Figure 4.

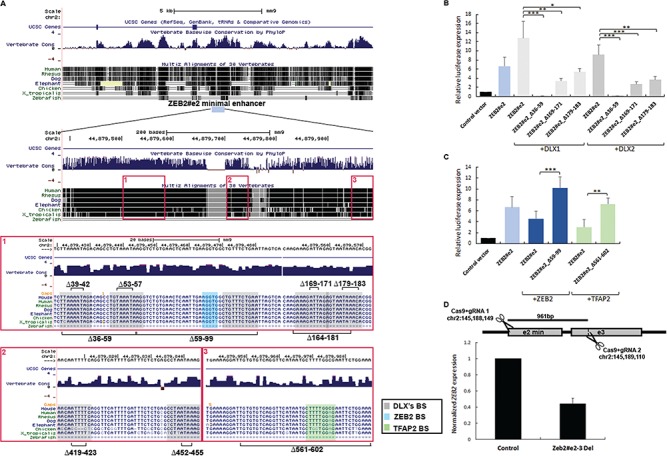
ZEB2#e2 activity is increased by DLX1/2 and decreased by ZEB2 and TFAP2. (A) UCSC Genome Browser conservation track of the ZEB2#e2 minimal sequence. Predicted TFBS for DLX1/2 (gray rectangle), ZEB2 (blue rectangle) and TFAP2 (green rectangle) are presented, along with the deletions of the binding sites for DLXs (∆39-42, ∆53-57, ∆59-99, ∆169-171, ∆179-183, ∆419-423 and ∆452-455), ZEB2 (∆59-99) and TFAP2 (∆561-602). (B) Luciferase assay demonstrating transcriptional activation mediated by the ZEB2#e2 minimal enhancer sequence in HEK293 cells. The ZEB2#e2 minimal enhancer showed 4–6-fold increased activity, as compared to the control (plasmid pGL4.23). DLX1/2 expression plasmids increased ZEB2#e2 activity 10–15-fold, as compared to the control. ZEB2#e2_∆36-59 mutant did not drive the luciferase reporter gene, while ZEB2#e2_∆169-171 and ZEB2#e2_∆179-183 mutants decreased the luciferase activity 3–4 and 2–2.5-fold, respectively. (C) ZEB2 and TFAP2 (both TFAP2α and TFAP2γ) expression plasmids decreased ZEB2#e2 activity 1.5–2.3-fold, as compared to the enhancer itself. ZEB2 expressed from the plasmid increased luciferase activity 2-fold in the ZEB2#e2_∆59-99. TFAP2 expressed from the plasmid increased luciferase activity 2.3-fold in the ZEB2#e2_∆561-602 mutant. Relative luciferase expression results are presented after normalization to Renilla activity and represent the mean ± standard deviation of three independent experiments (P < 0.05; Student’s independent t-test). (D) Predicted cleavage sites for paired guide RNA that was used for CRISPR/Cas9-mediated deletion of 961 bp. Quantitative qPCR shows reduced ZEB2 expression upon heterozygous ZEB23e2/3 deletion in HEK293 cells. Normalized expression levels of ZEB2 relative to control (P-value; mean ± standard error; n = 4; Student’s t-test).
