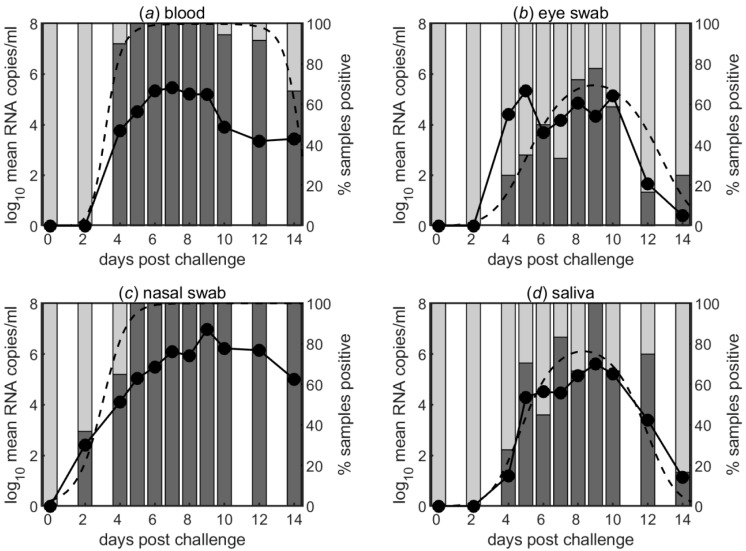
Figure 3.
Mean levels of viral RNA (log10 mean RNA copies/mL) in (a) blood, (b) eye swabs, (c) nasal swabs and (d) saliva swabs taken at different days post-challenge from goats infected with PPRV (left axis). The bars indicate the percentage of samples that were positive at each day post-challenge and the black dashed line indicates the model for the proportion of positive samples (right axis).

