Figure 4.
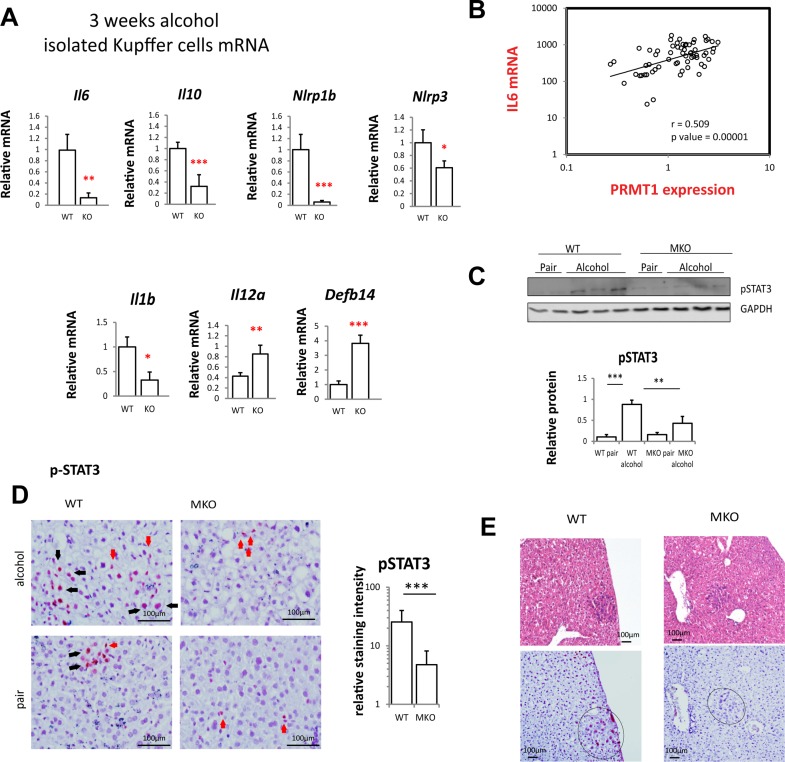
Kupffer cell PRMT1 controls expression of IL-6 and IL-10 and downstream STAT3 activation in hepatocytes. (A) PRMT1 flox/flox and PRMT1 flox/flox LysM Cre mice were fed alcohol for 3 weeks. Kupffer cells WT or KO were isolated from nonparenchymal cell fraction using anti-F4/80 beads. Relative mRNA levels in freshly isolated cells. Data presented as average ± SD, n = 3 animals per group. *p < 0.05; **p < 0.01; ***p < 0.001. (B) Correlation between PRMT1 mRNA and IL-6 mRNA expression in human blood monocytes (CD14+) of patients. N = 62. r = 0.508; p = 0.00001. (C) Relative pSTAT3 (Y705) levels in whole liver nuclear extracts from mice as in Figure 2. n = 6 mice per group. **p < 0.01; ***p < 0.001. (D) Immunohistochemistry staining of pSTAT3 in liver section from mice as in Figure 2. Black arrows, positive hepatocytes; red arrows, positive nonparenchymal cells. Scale bars: 100 μm. Right: pSTAT3 staining in hepatocytes was quantified using Aperio Image Scope. Data presented as average ± SD, n = 4 animals per group. ***p < 0.001. (E) Representative images of immunohistochemistry staining of pSTAT3 in liver section from mice as in Figure 2 showing a proliferating nodule. Scale bars: 100 μm.

