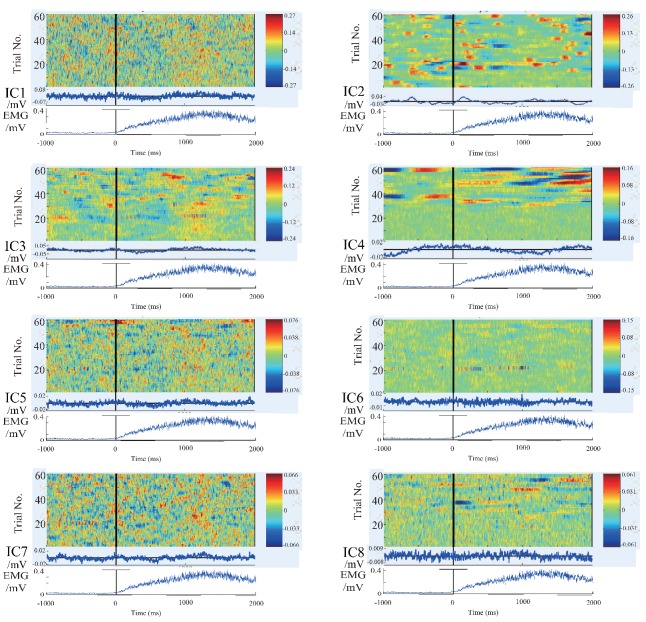
Figure 6.
The waveform of each independent component in each experiment of subject C. 8 subpanels in the figure correspond to 8 independent components (IC1–IC8). The upper part of each subpanel shows the amplitude of the independent component restored to all trials at time series, which is plotted by color. The horizontal axis is time, and the black vertical line divides the 3-s data to 1 s before the motion and 2 s after the motion. The vertical axis is the number of trials. The IC part is an average value of EEG signals of all the waveforms produced by all the trials. The lower part is an average value of EMG signal of all the trials.

