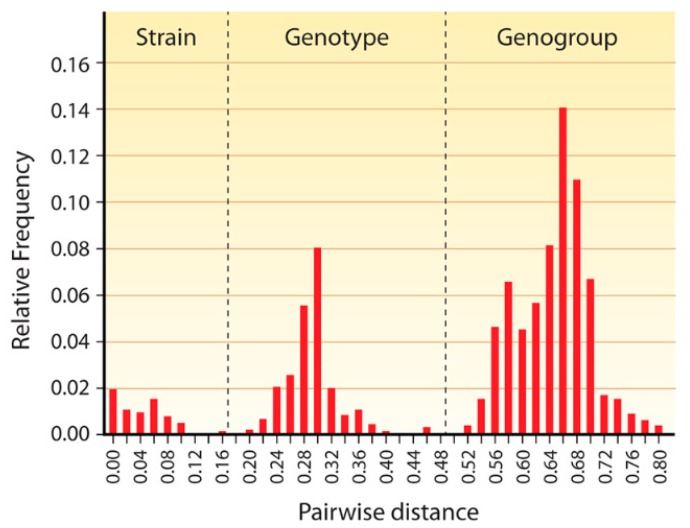
Figure 2.
Pairwise distance distribution histogram of complete VP1 genes of 59 sapoviruses. The peaks of 0–0.159, 0.198–0.471, and 0.522–0.807 correspond to the distance range of strains, genotypes, and genogroups, respectively. The cut-off values for genotype and genogroup clusters were <0.169 and <0.488, respectively, and are indicated by vertical dashed lines. From reference [37], with permission of authors and publisher.

