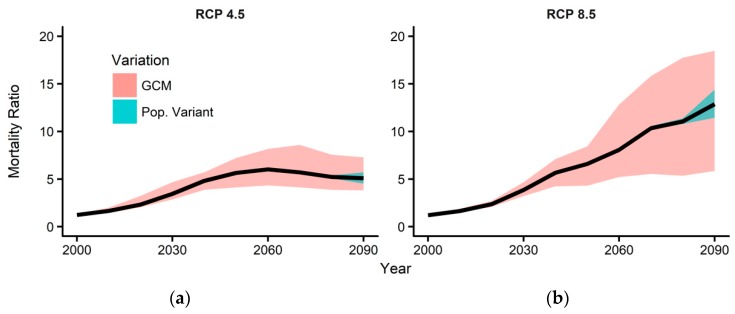
Figure 3.
Projections of summer temperature-attributable mortality ratio (MR) associated with climate and population changes from 2000 to 2100 under (a) RCP 4.5 and (b) 8.5. The red and blue shaded areas show the variations in the MR projections due to uncertainties in climate and population changes, respectively.

