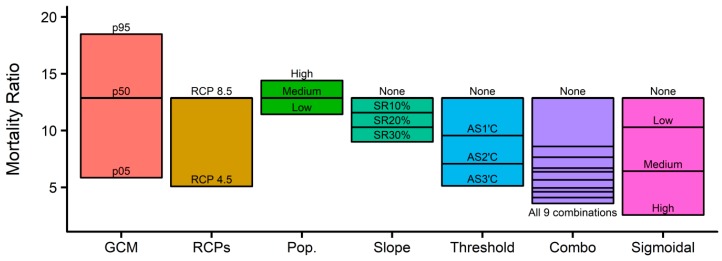
Figure 6.
Variations in mortality ratio associated with multiple climate, population, and adaptation scenarios in the 2090s (2090–2099). Orange, dark yellow, green, turquoise, light blue, purple, and magenta colors represent the range of variation associated with variations in GCMs, RCPs, population, and four adaptation scenarios (slope reduction, absolute threshold shift, the combination of the slope reduction and the threshold shift, and the sigmoid function), respectively.

