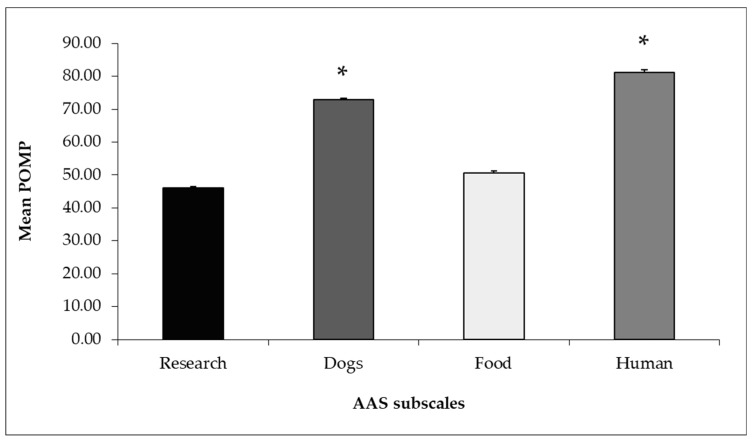
Figure 3.
Mean ± SE POMP scores of the four subscales of AAS as suggested by Gazzano et al. [6]. Data were analyzed using a Kruskal–Wallis test with Bonferroni’s correction (p = 0.001) (* = significant difference vs Research and Food). POMP: Percentage of maximum possible score.

