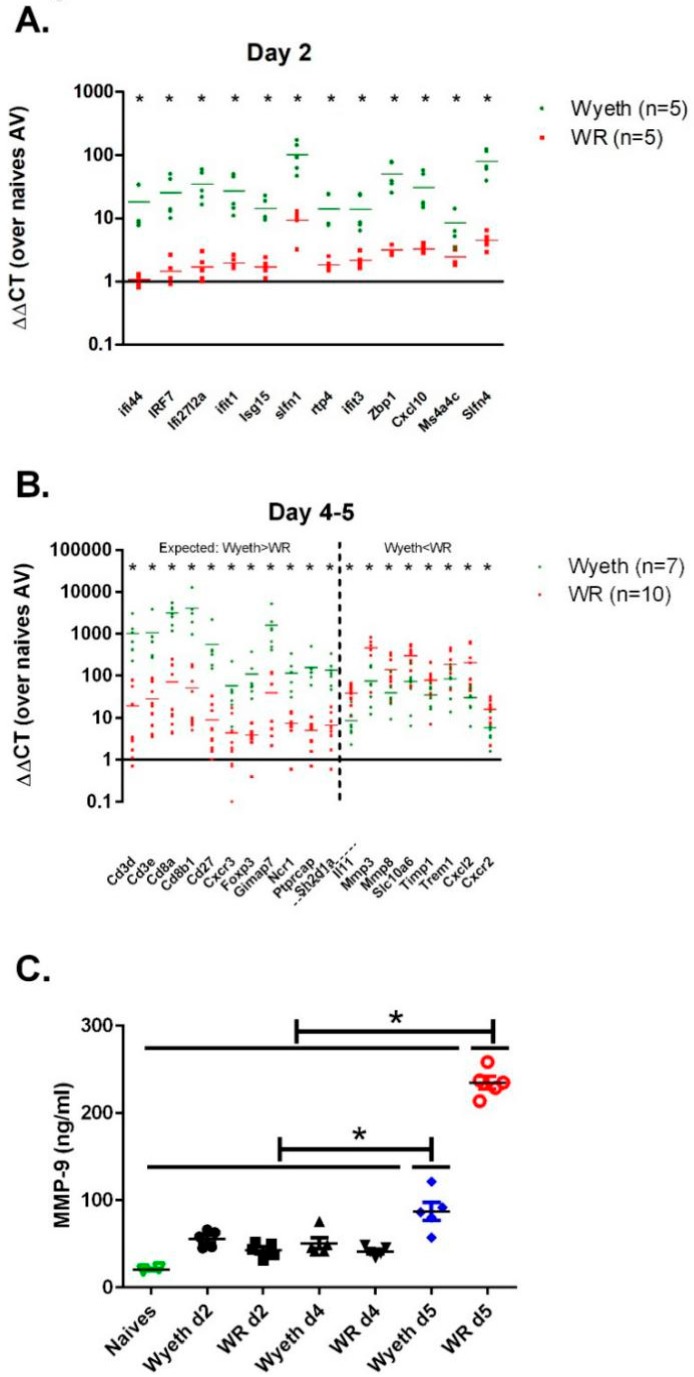
Figure 7.
Verification of gene expression analysis. Expression of selected genes was measured by quantitative real-time RT-PCR on brain RNA isolated from mice infected i.c. with VACV-Wyeth (106 pfu) or VACV-WR (102 pfu) 2 (A) 4 or 5 d.p.i (B). Vertical dashed line in panel B, marks the border between the set of genes that were expected to be higher in the VACV-Wyeth compared to the VACV-WR, based on the whole genome RNA seq (left to the line) and the genes that were expected to be higher in the VACV-WR compared to VACV-Wyeth (right to the line). (C) MMP-9 protein levels in sera of naive mice, VACV-Wyeth and VACV-WR infected mice at 2, 4, and 5 d.p.i. Asterisks denote p < 0.05 (t-test).

