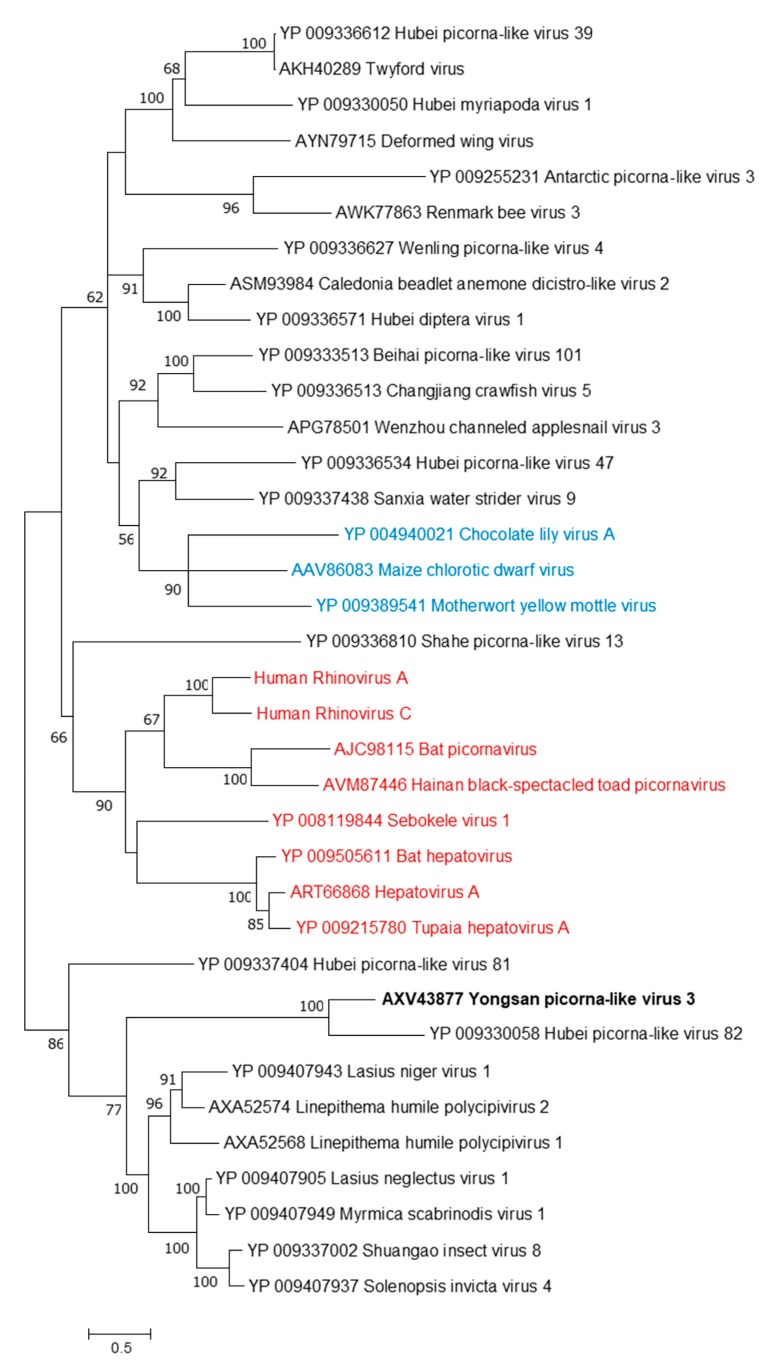
Figure 4.
The phylogenetic tree of Yongsan picorna-like virus 3 and related viruses. The analysis was inferred by using the Maximum Likelihood method based on the Le Gascuel 2008 model. Branch bootstrap values above 50 are shown and were based on 500 replicates. The tree is drawn to scale, with branch lengths measured in the number of substitutions per site. The tree is midpoint rooted. Viruses are colored based on host: invertebrate (black), vertebrate (red) and plant (blue).

