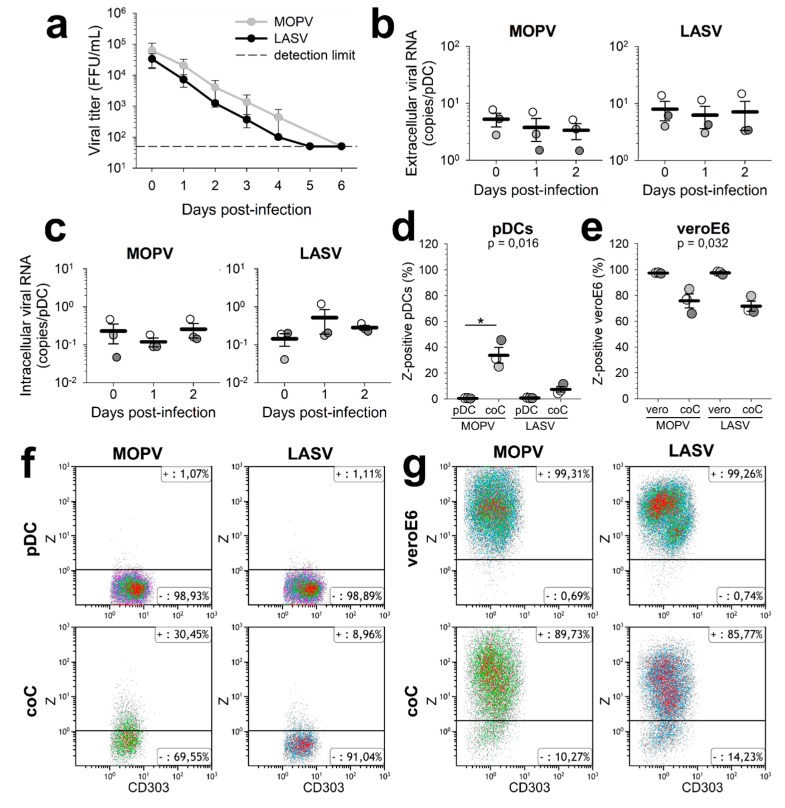
Figure 1.
pDC infection by MOPV and LASV. (a) pDCs were infected with MOPV or LASV (MOI = 0.1) and infectious particles in the culture medium quantified. (b,c) pDCs were infected with MOPV or LASV (MOI = 0.1) for 1 h (day 0), 1 day, or 2 days. Viral RNA in the culture medium (b) or inside the cells (c) was quantified by RT-qPCR. (d–g) VeroE6 cells were infected with MOPV-Zflag or LASV-Zflag (MOI = 0.3). After 24 h, pDCs were added to the cells, or infected with MOPV-Zflag or LASV-Zflag (MOI = 0.1). 24 h later, cells were stained for phenotypic markers and the Z protein. Conditions were: infected VeroE6 ("veroE6"), VeroE6 cultured with pDCs ("coC"), and infected pDCs (“pDC”). Z-positive pDCs (d–f) and VeroE6 cells (e–g) were quantified by flow cytometry. All data are presented as the mean and standard error of mean (SEM) of three independent experiments. ANOVA on Ranks followed by pairwise comparisons (Tukey test) were performed. Differences are significant for p < 0.05. When significant, P values of the ANOVA are indicated on the graph. Significant pairwise comparisons are indicated by a star (*).

