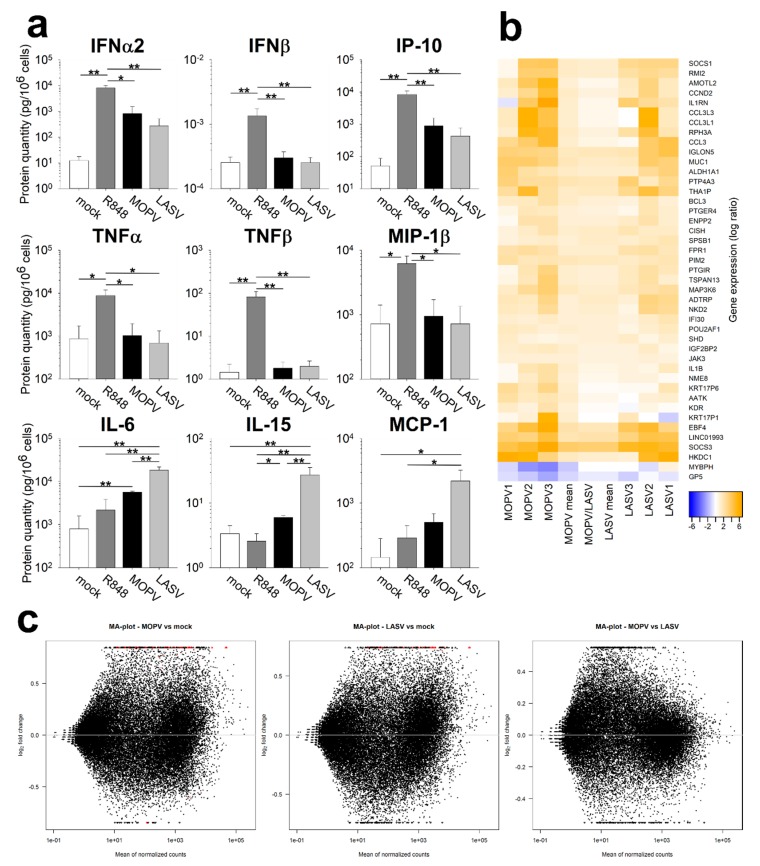
Figure 3.
MOPV- and LASV-infected pDCs show different patterns of activation. (a) pDCs were cultured for 16 h with culture medium (mock), R848 (1 µg/mL), MOPV, or LASV (MOI = 2). Protein levels were quantified using the Luminex assay. Data are presented as the means and SEM of five independent experiments. Wilcoxon tests were performed, and differences are significant for p < 0.05 (*) or p < 0.01 (**). (b,c) pDCs were cultured for 12 h in culture medium (mock), MOPV, or LASV (MOI = 1). Cellular mRNA from three independent experiments was quantified by poly-A amplification and next-generation sequencing. (b) Data show the differential expression of genes in MOPV relative to LASV (MOPV/LASV) infected cells or in MOPV or LASV infected cells relative to mock (1, 2, 3, and mean). Genes shown in this figure displayed significant differences of expression (adjusted p < 0.05). (c) MA plots for all pairwise comparison of data sets (MOPV/mock, LASV/mock and MOPV/LASV). Red dots indicate significantly different genes between the two conditions. Triangles correspond to features having a too low/high fold change to be displayed on the plot.

