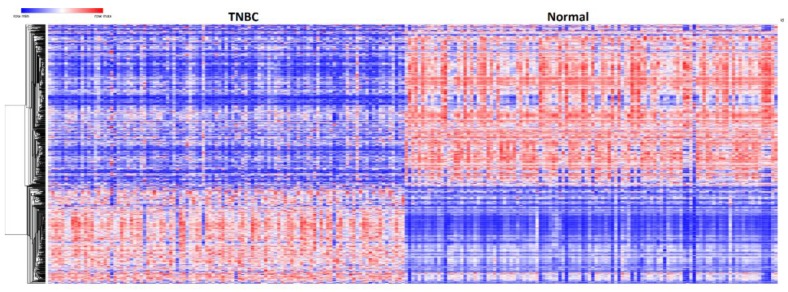
Figure 3.
Patterns of gene expression profiles for the 237 up and downregulated genes containing both germline and somatic mutations found to be significantly (p < 0.05) differentially expressed between patients with TNBC and control samples. Red color represents upregulation; blue color represents downregulation.

