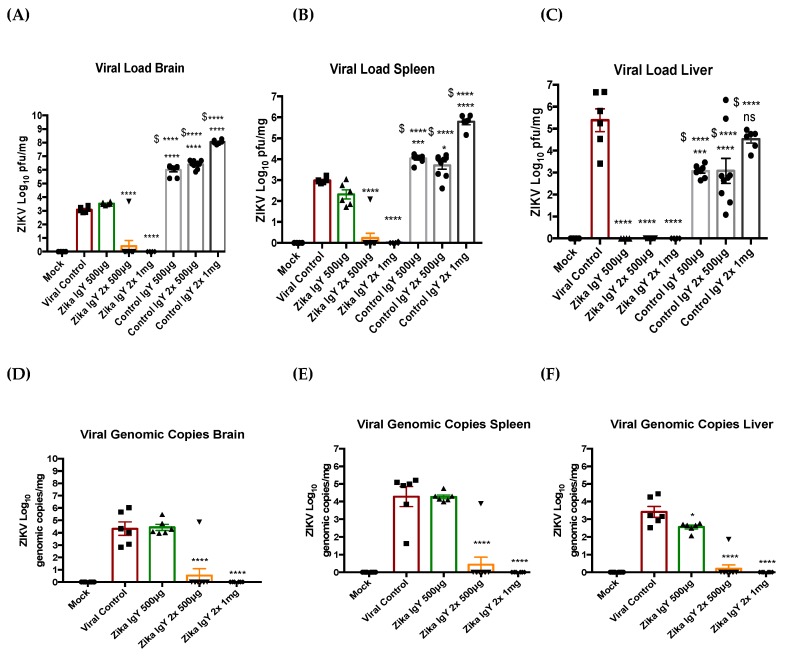
Figure 4.
The viral load reduction upon treatment with anti-ZIKV IgY: (A–C) The infectious viral load was quantified in the brain (A), spleen (B), and liver (C) via a plaque assay. (D–F) The viral genomic copy number was quantified in the brain (D), spleen (E), and liver (F) via RT-qPCR. The viral load of the treated mice was compared to the viral control group. * p < 0.05, ** p < 0.01, *** p < 0.005, **** p < 0.0001, and $ is the comparison to the matching ZIKV-specific IgY group.

