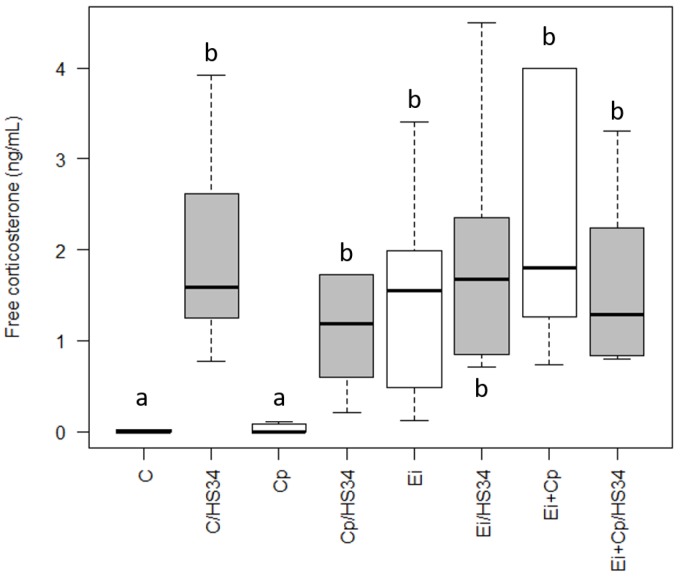
Figure 2.
Quantification of serum levels of free corticosterone. The boxplots represent the median plus the maximum and minimum scores by group. The different letters assigned to each boxplot indicate significant differences p ≤ 0.05 (Krukal-Wallis test). Control group (C); group infected with Eimeria spp. (Ei); group infected with Clostridium perfringens (Cp); group infected with Clostridium perfringens + Eimeria spp. (Ei + Cp). ‘/HS34’ beside the group name indicates the presence of heat stress.

