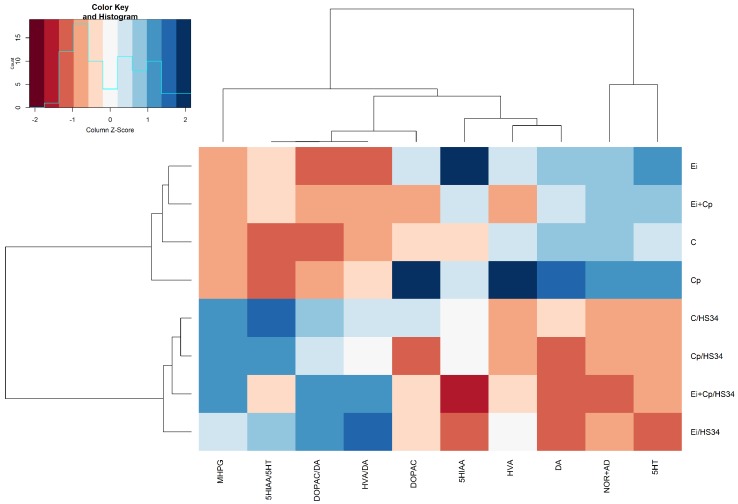
Figure 5.
Heat map with the average concentrations of neurotransmitters in the midbrain. The data were normalized to the mean of the control group (C), followed by normalization for each neurotransmitter. Groupings in rows and columns were made to identify similarities between neurotransmitters and were based on the Euclidean distance and complete agglomeration method. The distances are represented by dendrograms in the x- and y-axes. Control group (C); group infected with Eimeria spp. (Ei); group infected with Clostridium perfringens (Cp); group infected with Clostridium perfringens + Eimeria spp. (Ei + Cp). ‘/HS34’ beside the group name indicates the presence of heat stress.

