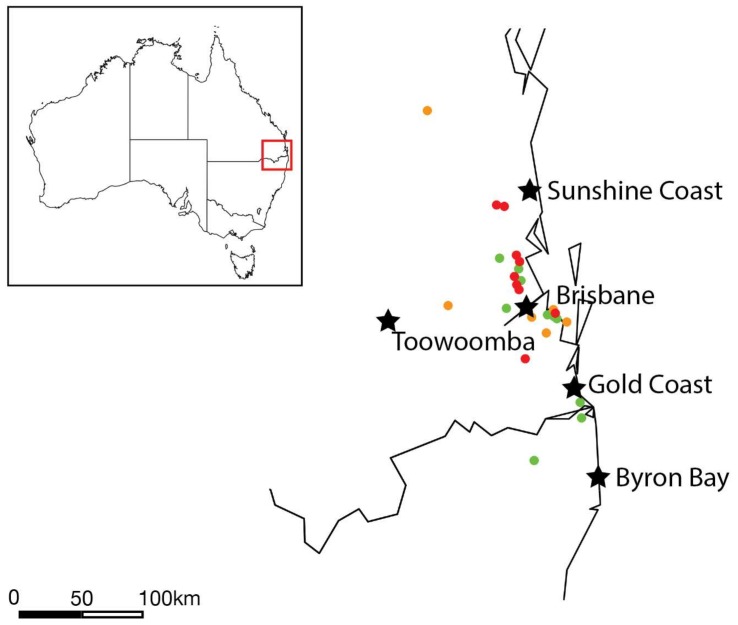
Figure 3.
Map showing the koala collection area spanning from north of the Sunshine Coast, Australia, across the New South Wales and Queensland boarder to Byron Bay in the south. Key urban areas are indicated by black stars, while the koala collection locations are colour coded by virus abundance with green points indicating no virus with the sample, yellow indicating low levels of virus (below 0.01% of total reads) and red indicating high abundance of virus (>0.01% of total reads).

