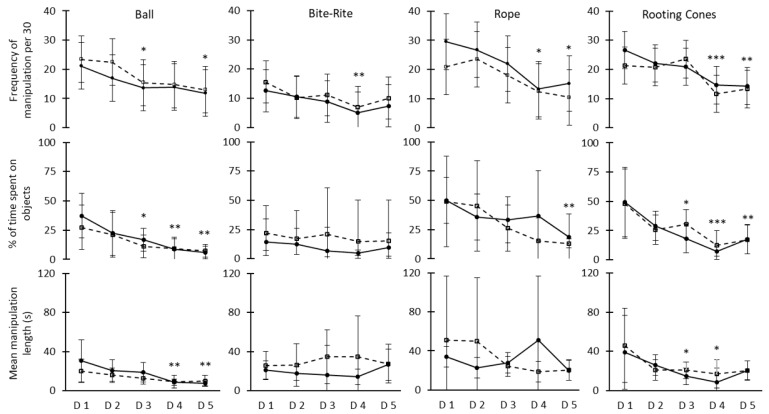
Figure 3.
Adjusted means with 95% confidence intervals of frequency of manipulation per 30 min (upper row), percentage of time spent on manipulation (middle row) and mean manipulation length in seconds (lower row) for treated (solid line) and control (dash line) objects. Significant differences between daily average values (day 2 to day 5) from treated and control objects combined and the average value on day 1 (Dunnett’s correction) is shown with * (p < 0.05), ** (p < 0.01), *** (p < 0.001).

