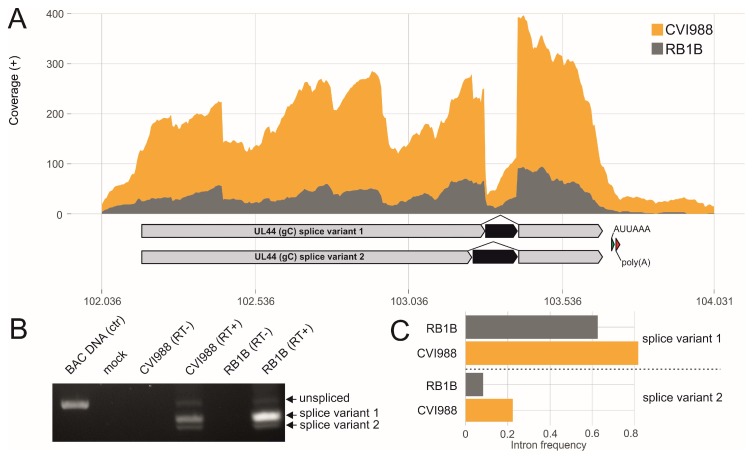
Figure 4.
Glycoprotein C (gC) splicing. (A) Visualization of RNA-seq coverage across the Marek’s disease virus (MDV) gC gene UL44 with respective introns in black. The green and red arrow indicate the canonical ATTAAA polyadenylation signal and the poly(A) cleavage site respectively. (B) RT-PCR was performed to validate gC splicing. PCR products were derived using forward/reverse primers to amplify the respective intron-flanking regions. (C) Comparison of the gC intron frequencies in RB1B and CVI988 infected primary chicken B cells.

