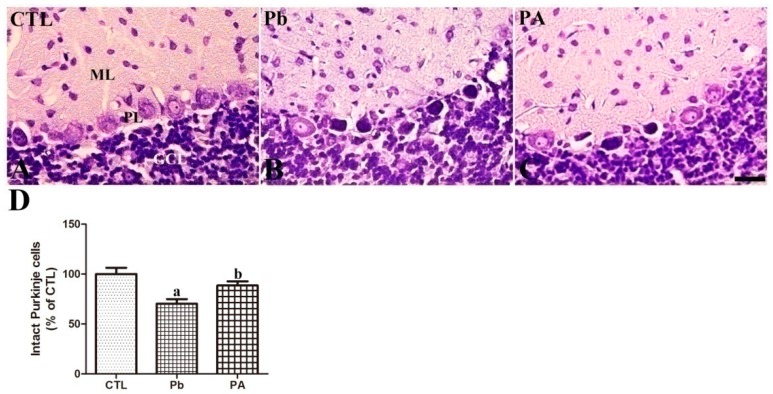
Figure 2.
Nissl staining of cerebellum (A–C) of offspring from CTL, Pb, and PA groups. GCL, granule cell layer; ML, molecular layer; PL, Purkinje cell layer. Bar = 25 μm. (D) The numbers of intact Purkinje cells in the cerebellum are expressed as percentages of the value in the CTL group. The number of intact Purkinje cells in three sections per offspring in non-overlapping fields, 12 rats were included in each group (n = 12 offspring per group; a p < 0.05, indicating a significant difference compared with the control group, b p < 0.05, indicating a significant difference compared with the Pb group). The bars indicate the means ± standard errors of the mean.

