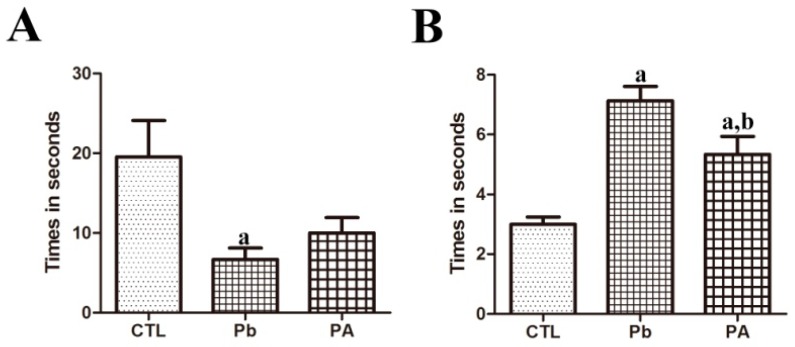
Figure 6.
Effect of Pb exposure and ascorbic acid treatment in the bar holding test (A) and wire mesh ascending test (B) among offspring from CTL, Pb, and PA groups. (A) The times during which the animal stayed on the bar in the bar holding test. (B) The amount of time the animal spent to reach the top of the wire mesh in the wire mesh ascending test (n = 12 offspring per group; a p < 0.05, indicating a significant difference compared with the control group, b p < 0.05, indicating a significant difference compared with the Pb group).

