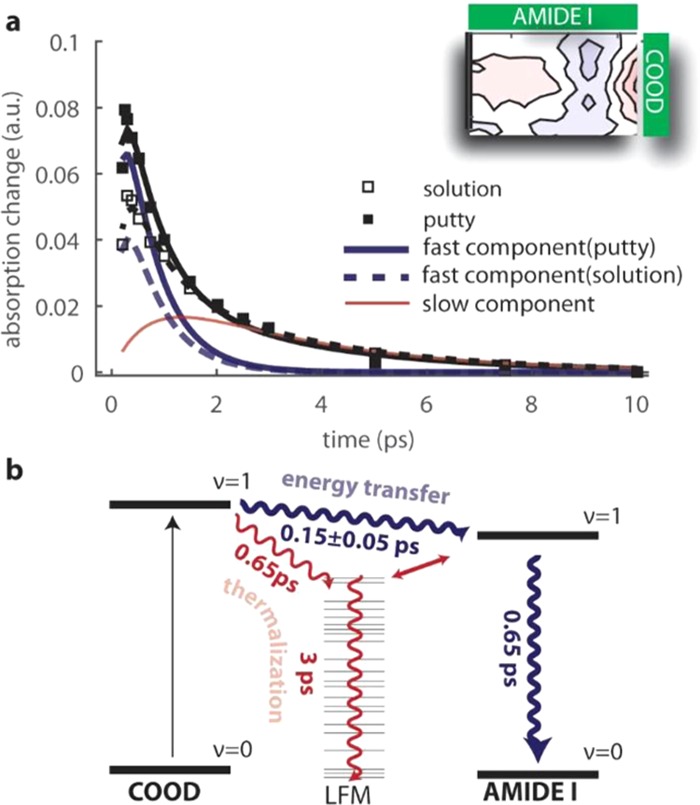
Figure 3.

a) Decay traces of the cross-peak in the νAM.I vibrational region for hyaluronic acid at a concentration of 20 mg/mL in the solution and putty states. The decay traces are normalized to the carboxylic acid intensity at early time delay. The solid and dashed black lines are fits to the relaxation model (described in the Supporting Information), for the putty and solution states, respectively. The blue lines represent the fast component: thick and dashed lines correspond, respectively, to the putty and solution states. The initial amplitude of the fast component (indicated with cent) is nearly two times larger in the putty state (cent = 0.13 ± 0.01) than in the solution state (cent = 0.077 ± 0.005). The red line represents the contribution of the slow component, whose initial amplitude cth is similar for the putty and solution states (cthputty ≈ cthsol. = 0.024 ± 0.004). Values reported are the mean and standard deviation obtained by averaging over three different independent measurements. (b) Schematic of the relaxation model describing the cross-peak dynamics. Red and blue lines refer, respectively, to the slow component (due to thermalization) and fast component (due to energy transfer) of the cross-peak dynamics. The value shown is the average with standard deviation for six independent measurements.
