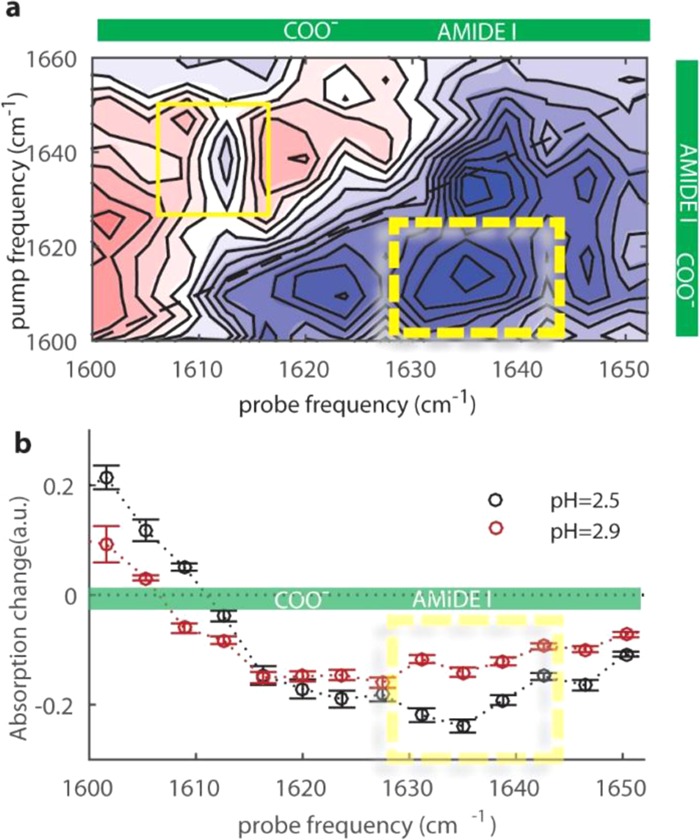
Figure 4.

(a) Difference 2D-IR spectrum for a solution of hyaluronic acid at pH 2.5 at a concentration of 20 mg/mL. The difference 2D-IR spectrum was obtained by subtracting the parallel signal from three times the perpendicular signal. The yellow rectangles indicate the cross-peak signals of the amide I and COO– modes. (b) Transient absorption spectra obtained by averaging over the pump-frequency region between 1600 and 1620 cm–1 at pH 2.5 and 2.9, and normalized with respect to the pure antisymmetric stretching signal of the carboxylate anion group (Figures S10 and S11).
