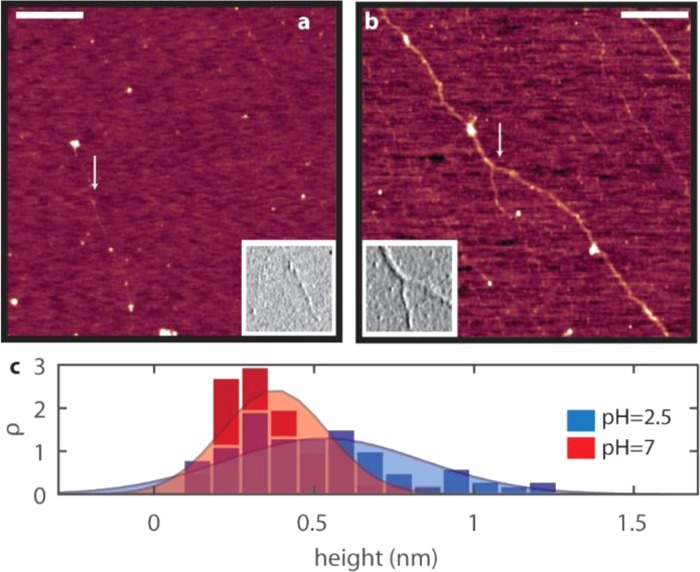
Figure 5.

On the top, AFM height images of HA filaments at pH 7 and 2.5, respectively, color coded from 0 nm (dark red) to 1.2 nm (white). The insets show amplitude images of smaller areas of 500 × 500 nm2, indicated by the arrows. Scale bar: 500 nm. On the bottom, filament height distributions with Gaussian fits.
