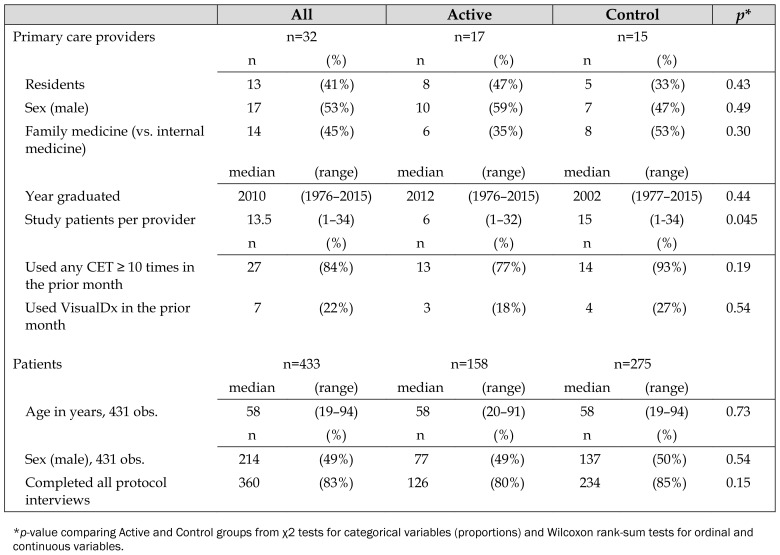
Table 1.
Characteristics of primary care providers and patients
| All | Active | Control | p* | ||||
|---|---|---|---|---|---|---|---|
| Primary care providers | n=32 | n=17 | n=15 | ||||
| n | (%) | n | (%) | n | (%) | ||
|
|
|||||||
| Residents | 13 | (41%) | 8 | (47%) | 5 | (33%) | 0.43 |
| Sex (male) | 17 | (53%) | 10 | (59%) | 7 | (47%) | 0.49 |
| Family medicine (vs. internal medicine) | 14 | (45%) | 6 | (35%) | 8 | (53%) | 0.30 |
| median | (range) | median | (range) | median | (range) | ||
|
|
|||||||
| Year graduated | 2010 | (1976–2015) | 2012 | (1976–2015) | 2002 | (1977–2015) | 0.44 |
| Study patients per provider | 13.5 | (1–34) | 6 | (1–32) | 15 | (1–34) | 0.045 |
| n | (%) | n | (%) | n | (%) | ||
|
|
|||||||
| Used any CET ≥ 10 times in the prior month | 27 | (84%) | 13 | (77%) | 14 | (93%) | 0.19 |
| Used VisualDx in the prior month | 7 | (22%) | 3 | (18%) | 4 | (27%) | 0.54 |
| Patients | n=433 | n=158 | n=275 | ||||
| median | (range) | median | (range) | median | (range) | ||
|
|
|||||||
| Age in years, 431 obs. | 58 | (19–94) | 58 | (20–91) | 58 | (19–94) | 0.73 |
| n | (%) | n | (%) | n | (%) | ||
|
|
|||||||
| Sex (male), 431 obs. | 214 | (49%) | 77 | (49%) | 137 | (50%) | 0.54 |
| Completed all protocol interviews | 360 | (83%) | 126 | (80%) | 234 | (85%) | 0.15 |
p-value comparing Active and Control groups from χ2 tests for categorical variables (proportions) and Wilcoxon rank-sum tests for ordinal and continuous variables.

