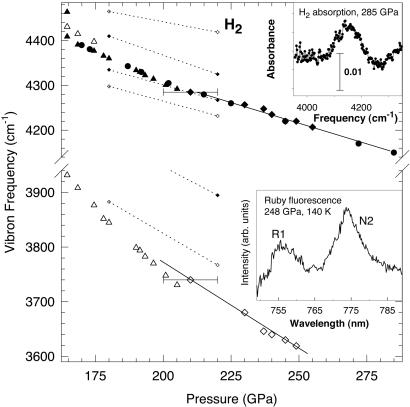
Figure 2.
Pressure dependence of the measured Raman and IR vibron frequencies compared with theoretical results. The large solid and open symbols are our IR and Raman data respectively. The solid curves are guides to the eye. The small solid and open symbols connected by dotted lines are the calculations from ref. 31. (Upper Inset) The IR absorption spectrum of a composite H2/ruby sample at 285 GPa. (Lower Inset) Ruby fluorescence spectrum at 248 GPa measured by the direct pumping technique with 705-nm excitation. The pressure is determined from the spectral positions of N2 and R1 ruby lines, according to the calibration of ref. 32, extrapolated to higher pressures. The accuracy of the pressure determination is estimated as ±5%.

