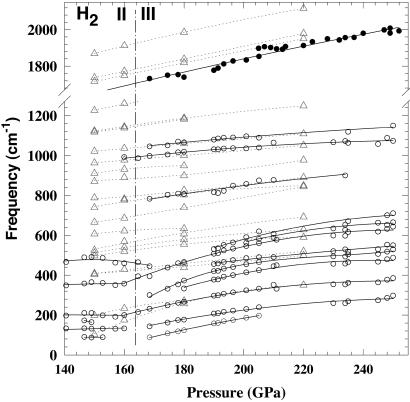
Figure 3.
Pressure dependence of the measured lattice mode frequencies and comparison with theoretical results. The solid and open symbols are our IR and Raman data, respectively. The solid lines are guides to the eye. The triangles connected by dotted lines are calculations from ref. 31. The pressure determination is described in the text and legend to Fig. 2.

