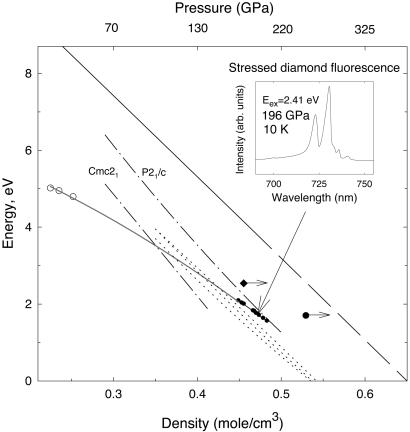
Figure 6.
Band gap of hydrogen as a function of density. The solid line is the model of optical data of ref. 45. extended linearly to gap closure (long dashed line). The long dash-dotted lines are the theoretical calculations for different crystal structures from ref. 3. The dotted lines are the theoretical calculations for Pca21, Cmc21, and P21/c structures (from left to right, respectively) from ref. 2 (the results are very close to each other). The solid diamond is Raman resonance scattering point obtained in ref. 9. The solid circle is the similar point obtained in this work. The arrows show that the pressure could be underestimated (9) or complete resonance conditions were not reached (see text). For comparison, estimations of the band gap of stressed diamond (this work) are also shown (Inset shows the stress-induced fluorescence of diamond at sample pressure of 196 GPa and 10 K). The peak positions of the two strongest diamond fluorescence peaks may correspond to the band gap (no correction for the phonon energy, possibly involved in case of indirect gap, is made). The open circles are the absorption edge values of stressed type II diamond obtained from direct measurements under pressure (42). The gray solid line is a guide to the eye. The hydrogen density is calculated from ref. 34 (extrapolated above 120 GPa) using the pressure measured inside the diamond anvil cell for all experimental data.

