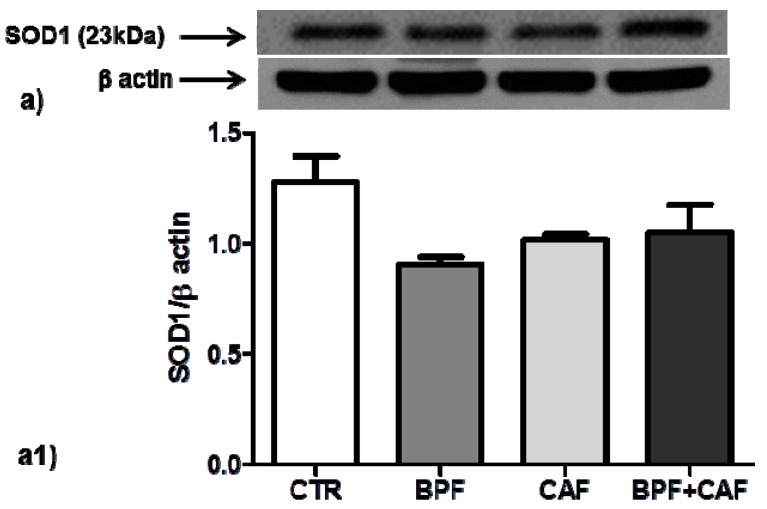
Figure 2.
SOD1 expression in rat kidney. Western blotting of SOD1 (a) in the kidney extracts of CTR, BPF, CAF and BPF + CAF rats; (a1) shows the densitometric quantification of the blots. Protein loading was verified by using the anti-β actin antibody. Data are means ± standard deviation (SD) of five determinations for each animal (n = 3). Statistical differences were evaluated by two-way ANOVA followed by Tukey’s multiple comparisons test.

