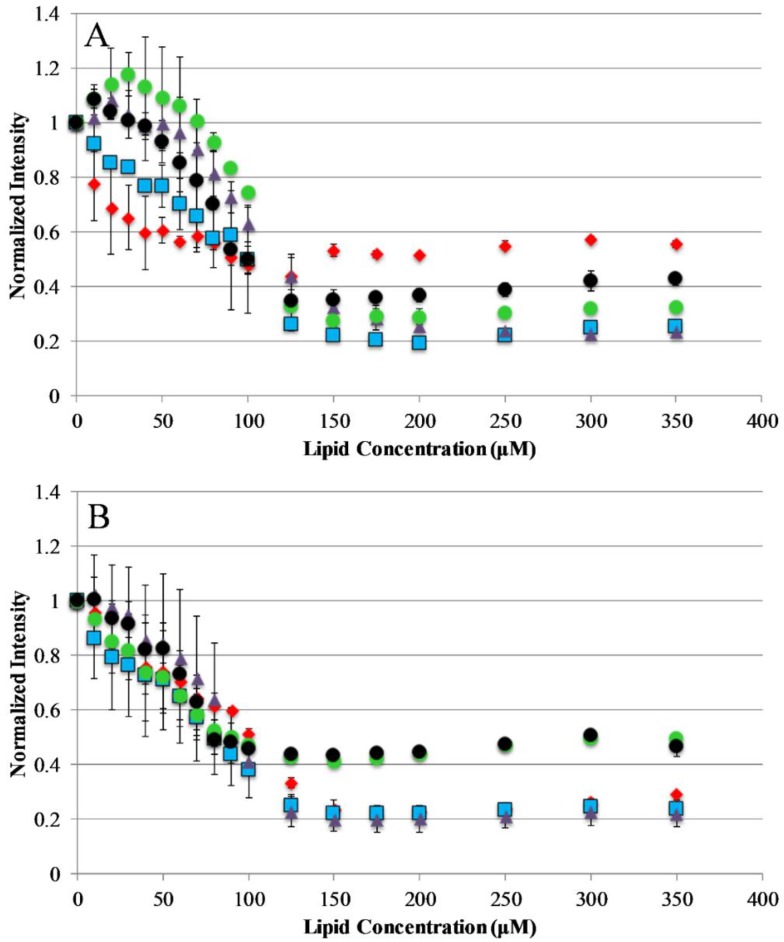
Figure 2.
Peptide binding to lipid vesicles: Peptide interaction with lipid vesicles was monitored using Trp emission spectra. The normalized Trp emission intensity is shown for each AP peptide titrated with either 75/25% PCPG (A) or 100% PC (B) lipid vesicles. For both graphs, AP3 is shown as red diamonds, AP3K as blue squares, APX as purple triangles, APX-17 as black circles, and APX-12 as green circles. Peptide concentration was 2 μM in all cases. Data shown are corrected for background fluorescence and represent averages of at least three replicate samples. Error bars represent the standard deviation of these data.

