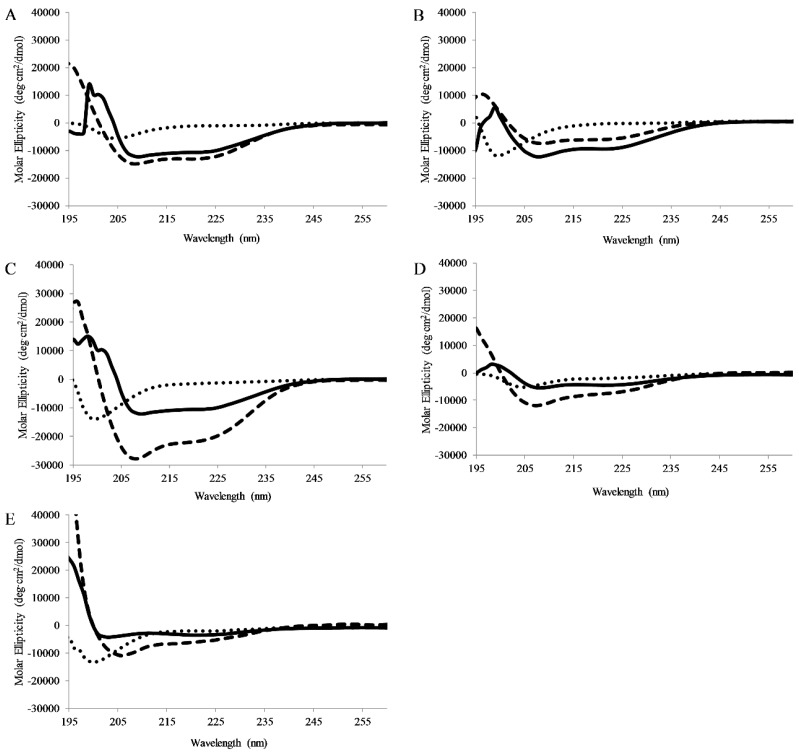
Figure 4.
Circular Dichroism Spectroscopy: Circular dichroism spectra of 5 μM (A) AP3, (B) AP3K, (C) APX, (D) APX-17, or (E) APX-12 Spectra were recorded in the presence of pH7 buffer, 1:1 TFE:pH7 buffer, or 250 μM 75:25 PC:PG SUVs. For all graphs, peptide in buffer is shown as dots, peptide in buffer:TFE as dashes, and peptide with Lipid vesicles as solid lines. All spectra are averages of 64 scans and were background subtracted.

