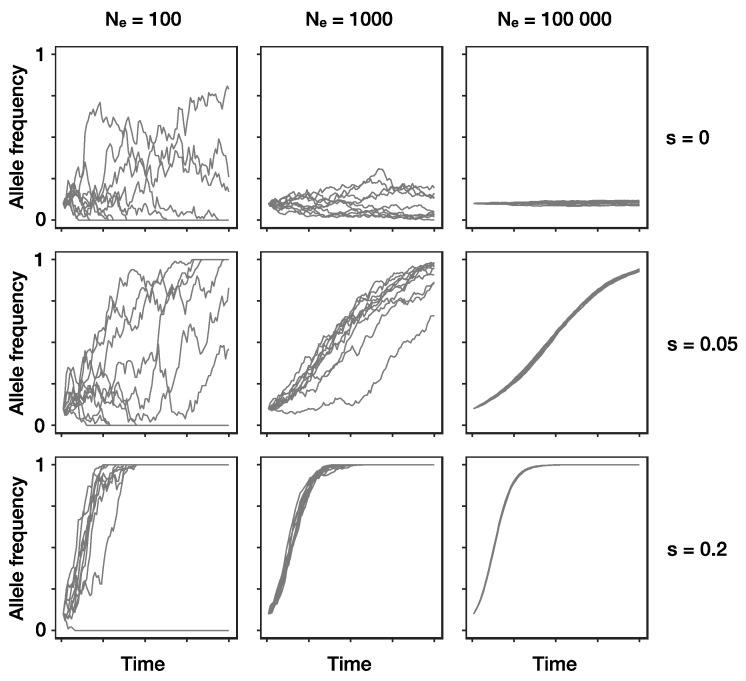
Figure 1.
The combined effects of drift and selection on genetic change over time (x-axis). Shown are simulated allele frequencies (y-axis) of a focal allele for different combinations of effective population size Ne (columns) and selection coefficient s (rows). A positive selection coefficient (s > 0) indicates a selective advantage of the focal allele compared to the other allele, if s = 0 both alleles are neutral and thus, allele frequency changes are only due to genetic drift. Each panel shows the results of ten independent replicates with an initial frequency of 0.1 for the focal allele. Note that when effective population size is small, even positively selected alleles sometimes go extinct due to drift (left column, middle and bottom row). Absolute frequencies k of the allele in generation t + 1 were obtained by randomly drawing from a binomial distribution with and , where w denotes the average fitness of the population and pt+1 denotes the expected frequency of the focal allele without drift in the next generation t + 1.

