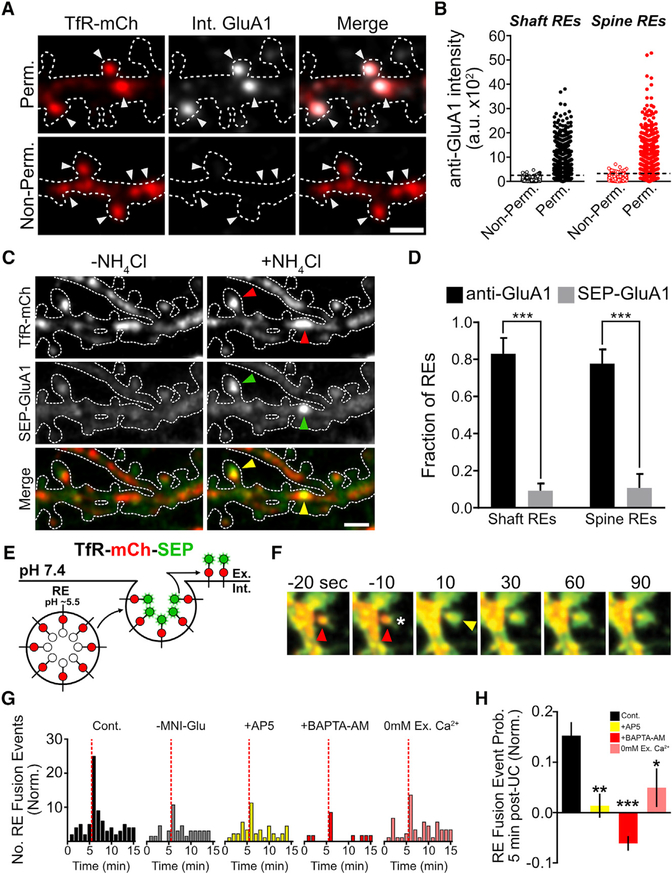
Figure 1. REs in Dendrites and Spines Harbor AMPA Receptors and Require Ca2+ for Fusion.
(A) Antibody-labeled GluA1 internalized during a 1-hr feeding period was selectively visualized (see Experimental Procedures) following fixation and permeabilization (top panels). Non-permeabilized neurons served as a control (bottom panels). Note the strong co-localization of internalized GluA1 and TfR-mCh in dendritic shaft and spine REs (arrowheads). Scale bar, 2 μm.
(B) Quantification of internalized GluA1 signal within shaft (black) and spine (red) REs for non-per-meabilized (n = 920 shaft REs from 10 neurons and 560 spine Res from 10 neurons) and permeabilized (n = 787 shaft REs from 11 neurons and 669 spine REs from 13 neurons) neurons.
(C) NH4Cl treatment of neurons co-expressing TfR-mCh and SEP-GluA1 reveals RE localization of SEP-tagged GluA1 in a small subset of dendritic shaft and dendritic spine REs (arrowheads). Scale bar, 2 μm.
(D) Quantification of the percentage of shaft and spine REs that contain detectable endogenous GluA1 (black bars) or expressed SEP-GluA1 (gray bars). ***p < 0.001 (one-way ANOVA, Bonferroni multiple comparisons test).
(E) Schematic of the dual-fluorescent reporter of RE fusion TfR-mCh-SEP. The SEP signal, but not the mCh signal, is quenched within the acidic RE lumen. Fusion events are observed as an abrupt increase in the SEP signal.
(F) Representative uncaging-induced spine exocytosis event. The asterisk marks the location of the uncaging pulses, the red arrowhead marks the mCh-positive RE within the dendritic spine prior to stimulation, and the yellow arrowhead marks the burst of SEP fluorescence indicative of a RE fusion event.
(G) Quantification of the number of fusion events before and after local stimulation of individual dendritic spines by uncaging (indicated by the dotted red line) plotted as the number of RE fusion events over time (normalized to control [left panel]) for, —MNI-Glu (MNI-Glu was excluded from the bath solution),AP5, BAPTA-AM, and 0 mM extracellular(Ex.) Ca2+-treated neurons(control, 181 spines from 29 neurons, — MNI-Glu 135spinesfrom 21 neurons, AP5 162 spines from 24 neurons, BAPTA-AM 158 spines from 15 neurons, 0 mM Ex. Ca2+ from 106 spines from 24 neurons).
(H) Quantification of the probability of a stimulated dendritic spine undergoing an RE fusion event within a 5-min window following glutamate uncaging, normalized to the —MNI-Glu control. ***p < 0.001, **p < 0.01, *p < 0.05 (n = number of neurons, one-way ANOVA, Bonferroni multiple comparisons test).
All error bars represent the SEM.

