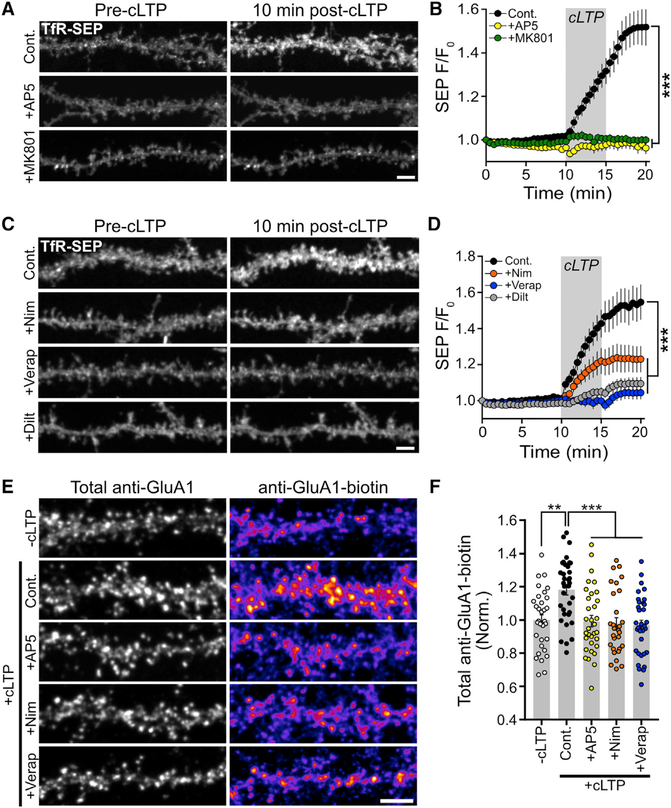
Figure 2. L-VGCCs Are Required for Activity-Dependent RE Fusion and AMPA Receptor Surface Delivery.
(A) Representative dendritic segments from TfR-SEP-expressing hippocampal neurons before and 10 min after cLTP stimulation for control, AP5-treated (50 μM), and MK801-treated (10 μM) neurons. Scale bar, 5μm.
(B) Quantification of RE cargo delivery over time for control (n = 8 neurons), AP5-treated (n = 10 neurons), and MK801-treated (n = 11 neurons) neurons. Grey box indicates the duration of the cLTP stimulus. AP5 and MK801 were present only during the cLTP stimulation. ***p < 0.001 (one-way repeated-measures ANOVA, Bonferroni multiple comparisons test).
(C) Representative segments of hippocampal neurons showing surface TfR-SEP signal before and 10 min after cLTP stimulation for control, nimodipine-treated (10 μM), verapamil-treated (25 μM), and diltiazem-treated (50 μM) neurons. Scale bar, 5 μm.
(D) Quantification of RE cargo delivery overtime for control (n = 11 neurons), nimodipine-treated (n = 12 neurons), verapamil-treated (n = 12 neurons), and diltiazem-treated (n = 13 neurons) neurons. Grey box indicates the duration of the cLTP stimulus. Nimodipine, verapamil, and diltiazem were present only during the cLTP stimulation. ***p < 0.001 (one-way repeated-measures ANOVA, Bonferroni multiple comparisons test).
(E) Representative segments of neurons stained for total surface GluA1 (total anti-GluA1, left column) and for newly inserted surface GluA1 (anti-GluA1-biotin, right column) for the following conditions: unstimulated negative control (—cLTP), cLTP-stimulated positive control (Cont.), cLTP-stimulated plus AP5 (100 μM, cLTP+AP5), cLTP stimulated plus nimodipine (10 μM, cLTP+Nim), and cLTP stimulated plus verapamil (25 μM, cLTP+Verap). Scale bar, 5 μm.
(F) Quantification of the normalized (to unstimulated control neurons) anti-GluA1-biotin signal for unstimulated negative control neurons (—cLTP, n = 32), positive control cLTP-stimulated neurons (Cont., n = 35), and cLTP-stimulated neuronstreated with AP5 (+AP5, n = 33), nimodipine (+Nim, n = 29), orverapamil (+Verap, n = 33). ***p < 0.001, **p < 0.01 (n = number of dendritic segments, one-way ANOVA, Bonferroni multiple comparisons test).
All error bars represent the SEM.

