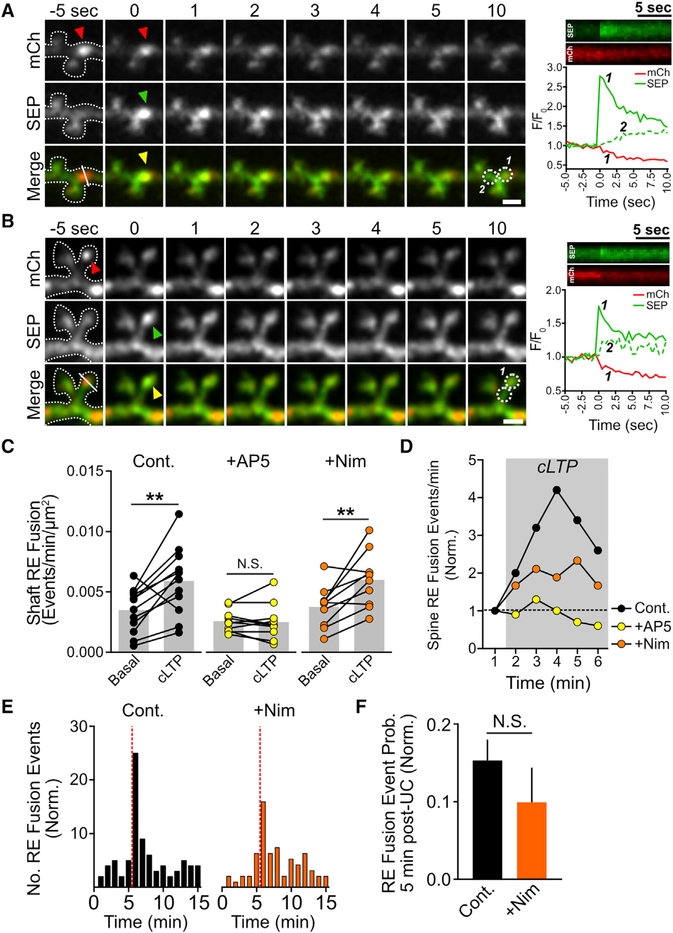
Figure 4. NMDA Receptor Activation, but Not L-VGCC Activation, Is Required for Initiation of RE Fusion.
(A and B) RE fusion events reported by TfR-mCh-SEP occur within dendritic shafts (A) and dendritic spines (B) during cLTP stimulation. Red arrowheads indicate the presence of the mCh-positive RE prior to the fusion event, while green and yellow arrowheads indicate the appearance of the SEP signal. Kymographs for each channel (generated from the line displayed in the bottom left panel of the color merge) and a plot of the relative intensity for each channel at the site of fusion (circle 1) or at an adjacent site (circle 2) are shown on the bottom right panel of the color merge. Scale bars, 2μm.
(C) Quantification of the rate of dendritic shaft RE fusion events before and after cLTP stimulation for control (n = 12), AP5-treated (n = 10), or nimodipine-treated (n = 10 neurons) neurons. **p < 0.01 (paired Student’s t test).
(D) Quantification of the pooled normalized rate of dendritic spine RE fusion events before and during cLTP stimulation for control (82 total events from 5 neurons), AP5-treated (55 total events from 7 neurons), or nimodipine-treated (96 total events from 7 neurons) neurons.
(E) Histograms showing the normalized distribution of dendritic spine RE fusion events before and after local stimulation of individual dendritic spines by MNI-glutamate uncaging (timing of the uncaging stimulus is indicated by the dotted vertical red line) for control (left) and nimodipine-treated (right) neurons (control, 181 spines from 29 neurons; nimodipine, 130 spines from 25 neurons). Note that the control dataset shown here is the same shown in Figure 2F.
(F) Quantification of the probability of spine RE fusion within a 5-min window following stimulation, normalized tothe –MNI-Glu control (see Figures 2F and 2G). N.S., not significant (two-tailed Student’s t test).
All error bars represent the SEM.

