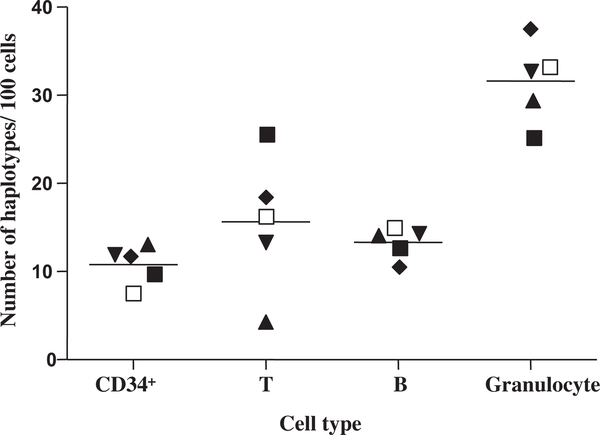
Fig. 3.
Total number of haplotypes defined by nucleotide substitutions relative to the aggregate or consensus sequence in a population of single CD34+, T, and B cells, and granulocytes. The data are taken from Ogasawara et al. [41]. Different donors are demonstrated by different shapes. The horizontal lines denote the mean values.

