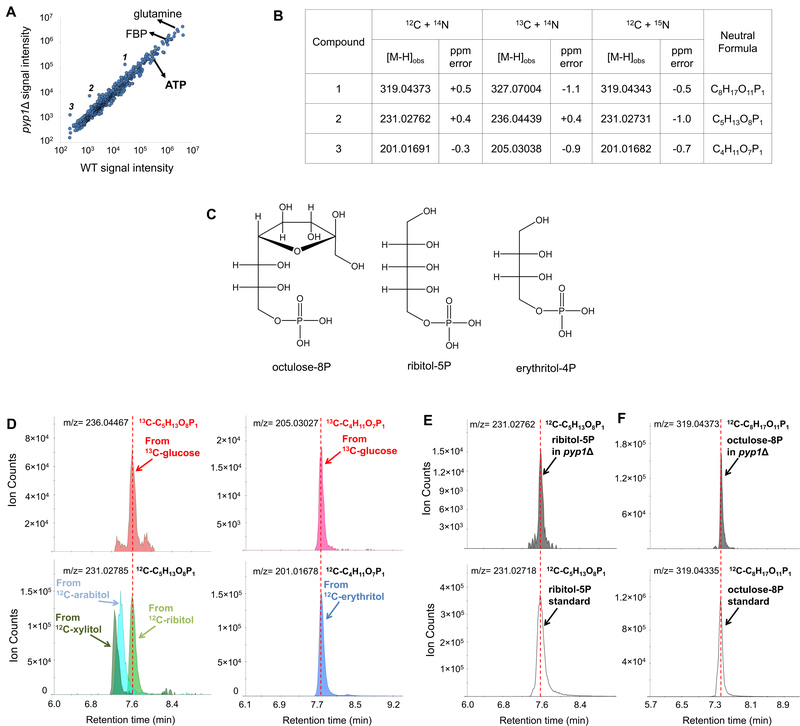
Figure 1. Metabolomic phenotype of pyplΔ cells.
(A). Metabolite profiles from glucose-grown wild type and pyp1Δ yeast cells detected by untargeted negative ion mode LC-high resolution MS. 1, 2, and 3 represent compounds with significantly different signal intensity between wild type and pyp1Δ cells. The x-axis represents the average of signal intensity in WT cells (N = 3). The y-axis represents the average of signal intensity in pyp1Δ cells (N = 3). Adduct and isotopic peaks were excluded. (B). Impact of 13C- and 15N-labeling on peaks of interest. Compounds 1, 2 and 3 were assigned formula as C8H17O11P1, C5H13O8P1 and C4H11O7P1 respectively. (C). Chemical structures of octulose-8P, ribitol-5P and erythritol-4P. (D). Extracted ion chromatograms of polyol phosphates produced from 13C-glucose (above) or by phosphorylation of 12C-polyols fed to the pyp1Δ cells (below). pyp1Δ cells growing exponentially on 2% 13C-glucose was switched to 2% 12C- polyols. Yeast metabolome right before the switch and four hours after the switch were analyzed by LC- MS. Retention time identifies the glucose-derived five carbon polyol phosphate as ribitol-5-phosphate and the four carbon polyol phosphate as erythritol-4P. (E and F). Extracted ion chromatogram for endogenous ribitol-5P (E) and octulose-8P (F) compared to synthetic standards.

