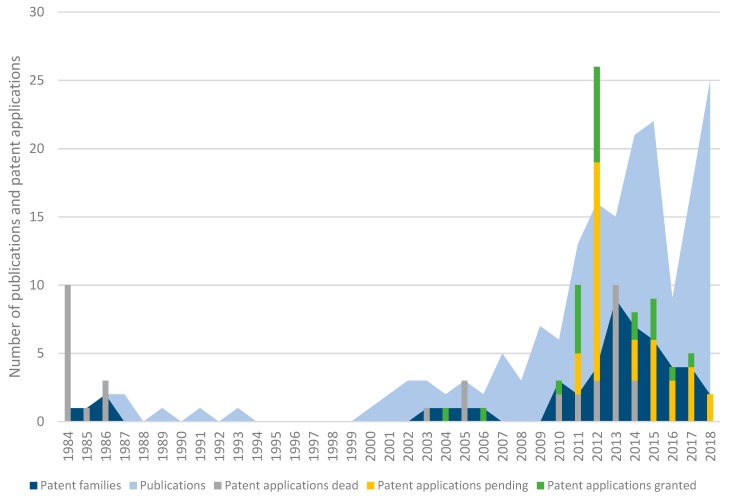
Figure 1.
An overview of the number of scientific publications, patent families, patents, and patent applications in the field of phage biocontrol in crop production organized by year. The light blue area chart represents the number of scientific publications and the dark blue area chart the number of patent families per priority year. The bars represent the number of patent applications per priority year: green (“Granted patents”) corresponds to the number of granted patents, yellow (“Pending applications”) to pending applications, and grey (“Dead applications and patents”) to dead patents and applications. This last group consists of patents and applications that are abandoned, refused, withdrawn, deemed to be withdrawn, or lapsed.

