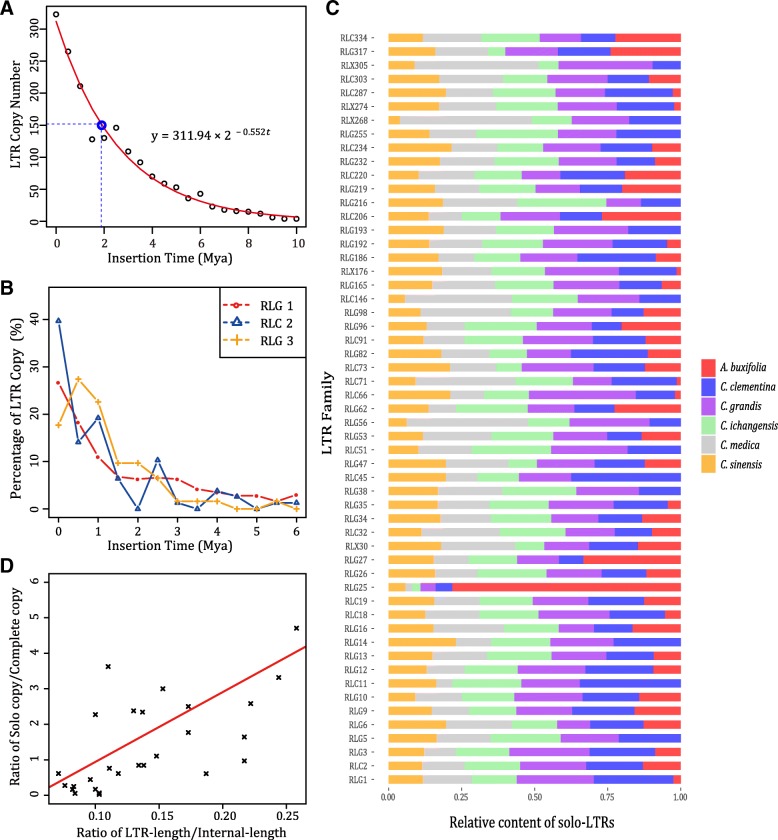
Fig. 6.
Insertion time and formation factor of LTR. a LTR insertion time distribution. b Insertion time distribution of three LTR families. c Relative content of solo-LTRs in six Citrus genomes. Some LTR families keep relative stable like RLC2 and RLG5, while other LTR families shows unstable and may become more active in one specie like RLG25. d Solo-LTR formation factor. The ratio of LTR-length/Internal-length shows clear positive correlation with the ratio of Solo copy/Complete copy

