
Fig. 1.
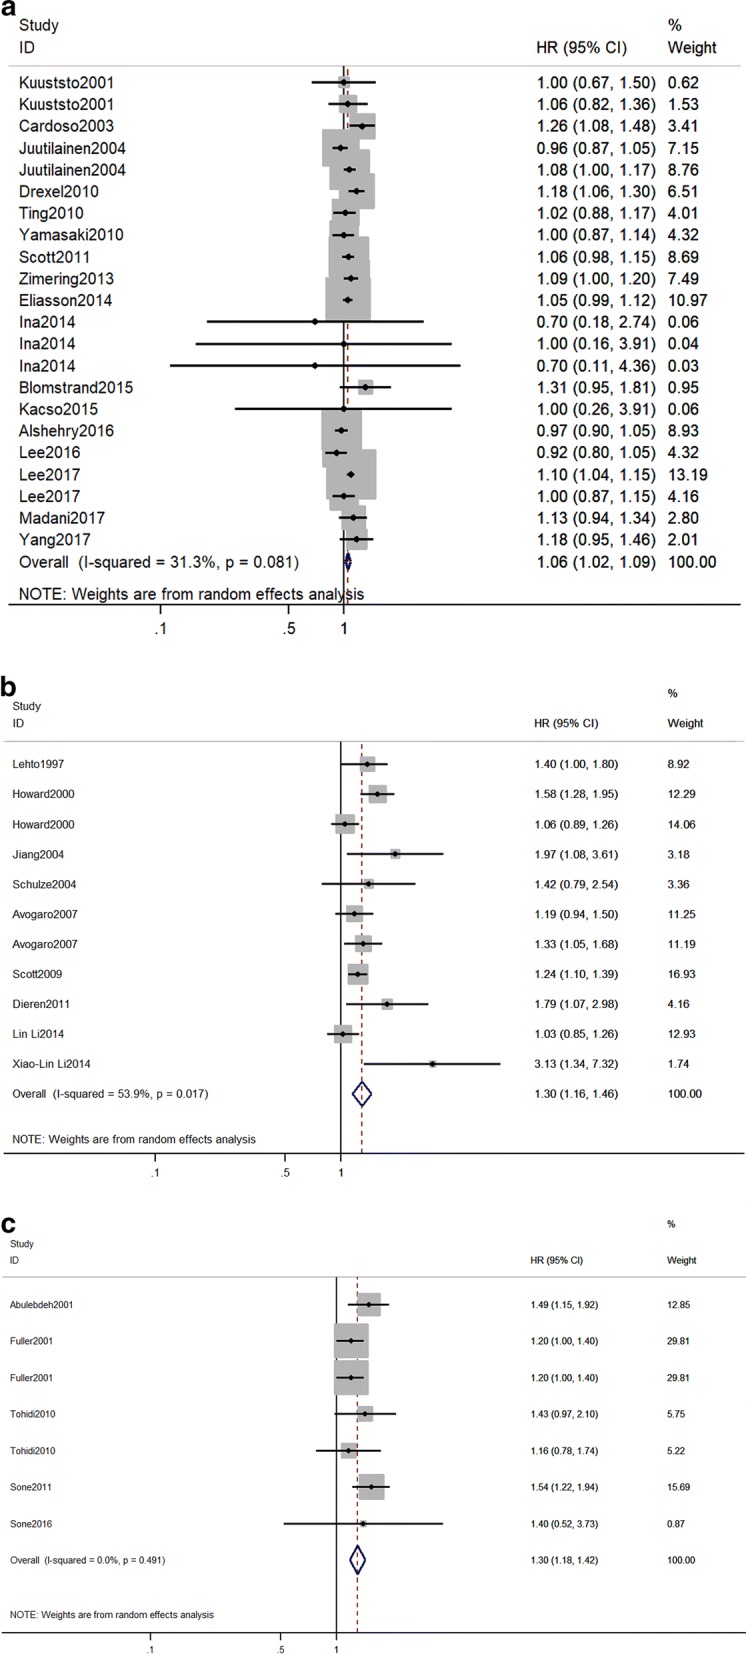
Forest plot for the effect of triglycerides on the risk of cardiovascular diseases in individuals with type 2 diabetes mellitus. RR and 95% CI for cardiovascular diseases and a 1 mmol/l increase in TG levels, b the highest versus the lowest category of TG, c 1 mmol/l increase in log TG levels. Studies are listed by date of publication. Boxes represent the RR and lines represent the 95% CI for individual studies. The diamonds and their width represent the pooled RRs and the 95% CI, respectively. RR relative risk