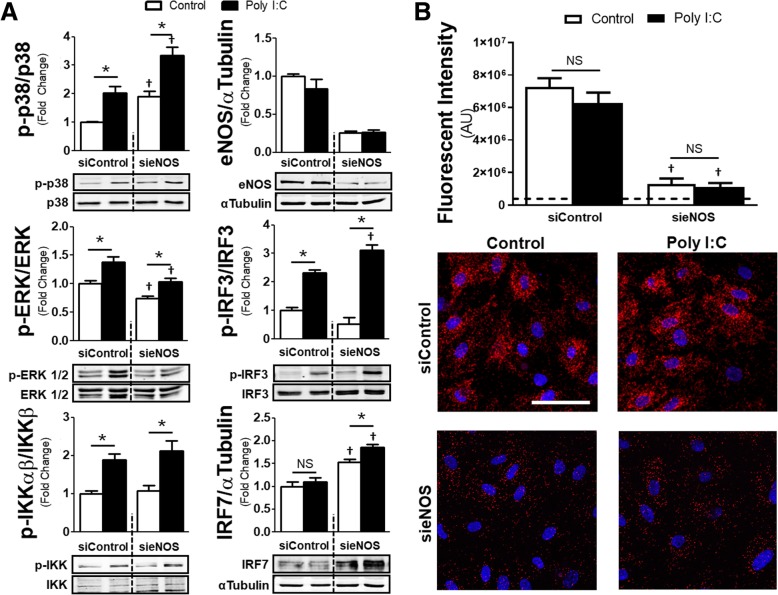
Fig. 3.
Alterations in MAPK, IRF phosphorylation and p38-eNOS proximity ligation signal in eNOS knockdown: a Normalized protein ratios and associated western blot images of HMVECs exposed to siRNA (siControl or sieNOS) for 72 h and then treated with Poly I:C (10 μg/mL) for 90 min. Images show band intensity for p-p38, p38, p-ERK 1/2, ERK 1/2, p-IRF3, IRF3, p-IRF7, IRF7, eNOS or α-tubulin with ratios of phosphorylated protein to respective total protein or eNOS to α-tubulin (n = 4 replicates per group). b Total fluorescent signal (intensity) using proximity ligation assays between cells exposed to siRNA (siControl or sieNOS) for 72 h and then treated with Poly I:C (10 μg/mL) for 90 min (top). Representative images of PLA signal (red) with nuclear stain (blue) for the different PLA treatment groups (bottom). Scale bar indicates 60 μm (n = 7 replicates per group). * = p < 0.05 between compared groups, † = p < 0.05 between group compared to respective siControl group, NS = non-significant

