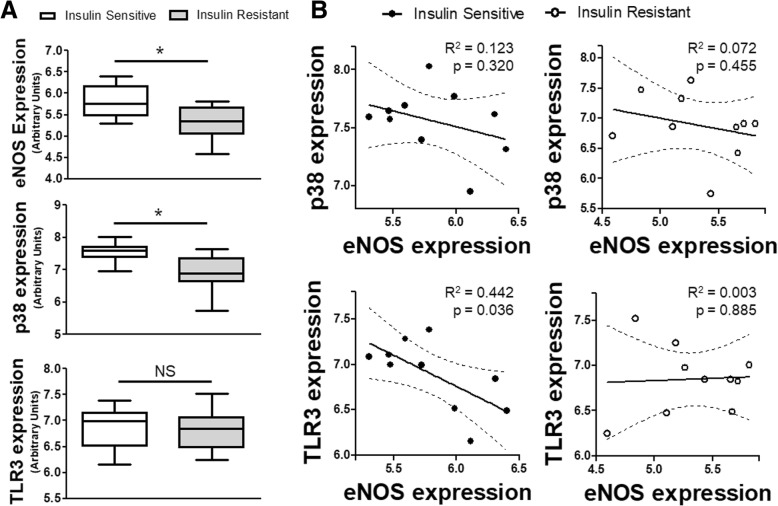
Fig. 7.
eNOS, p38 and TLR3 expression in insulin sensitive and insulin resistant patients: a Relative gene expression for eNOS, p38 and TLR3 from omental tissue biopsies obtained from insulin sensitive and insulin resistance patients (n = 10 per cohort). b Linear regression analysis (solid line) with 95% CI (dashed lines) for matched pair expression of p38 and eNOS or TLR3 and eNOS for insulin sensitive (left) and insulin resistance (right) cohorts. p and R2 values of regression analysis as shown. * = p < 0.05 between designated groups. NS = non-significant

