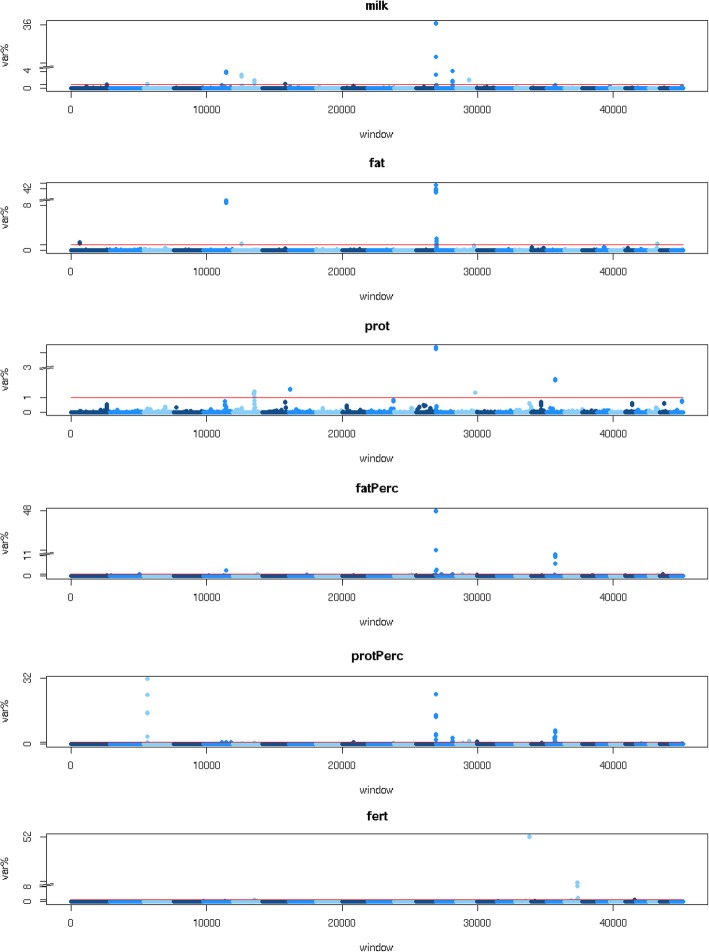
Fig. 2.
Local GEBV variance. Milk = milk yield, fat = fat yield, prot = protein yield, fat% = fat percentage, prot% = protein percentage, fert = fertility, var.% = variance explained by an interval as percentage of the sum of the variance explained by the non-overlapping intervals that explained the most variance. The red line corresponds with var.% = 1

