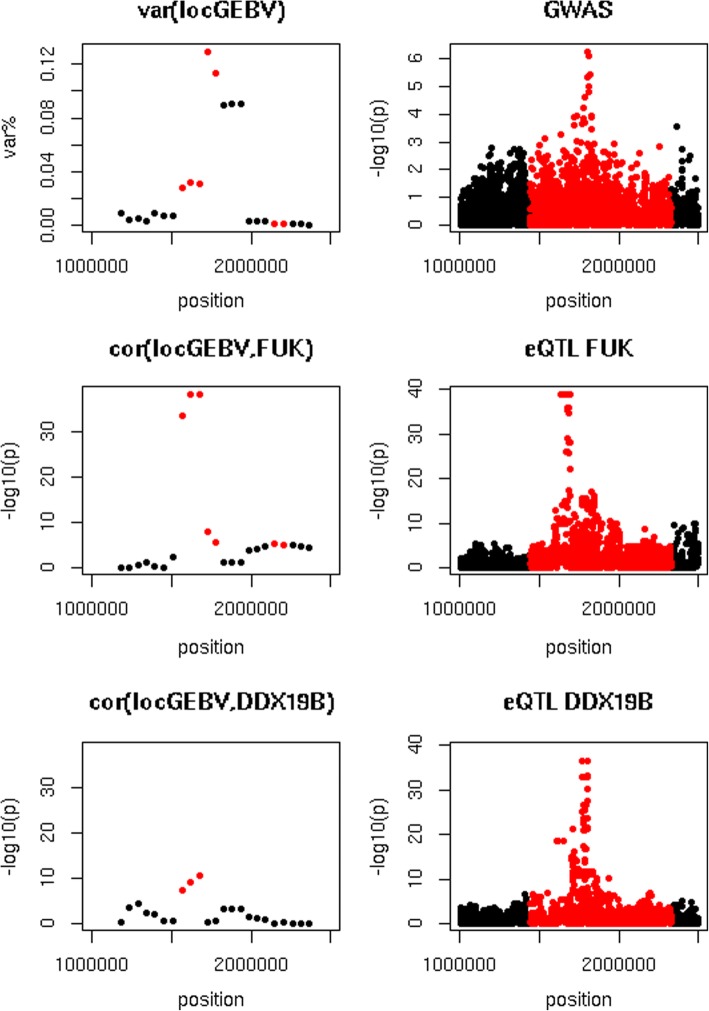
Fig. 5.
Association between FUK and DDX19B expression and fat yield. Top left = variance of local GEBV of 250 kb intervals where var.% = variance explained by an interval as percentage of the sum of the variance explained by the non-overlapping intervals that explained the most variance, top right = GWAS for fat yield, middle left = −log10(p) of correlations between local GEBV and FUK expression, middle right = association between sequence variants and FUK expression, bottom left = −log10(p) of correlations between local GEBV and DDX19B expression, bottom right = association between sequence variants and DDX19B expression. In all graphs, intervals or variants located within intervals with a pcor(locGEBV,expr) ≤ 10− 5 are indicated in red

