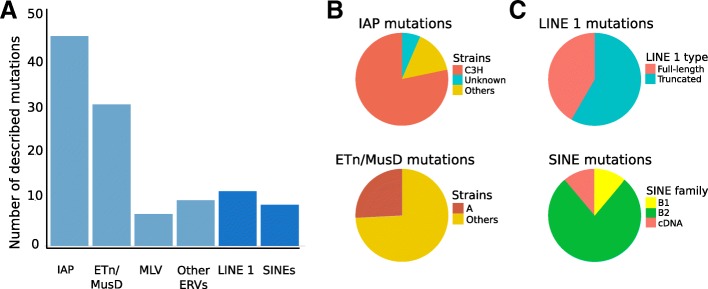
Fig. 1.
Distribution of mouse mutations caused by TE insertions. a Numbers of published mutations caused by different TE types. b Strain bias for IAP and ETn/MusD insertional mutations. c Upper panel – proportion of LINE1 insertional mutations that are full length or near full length. Lower panel shows high proportion of B2 SINEs among insertional mutations

