Fig. 1.
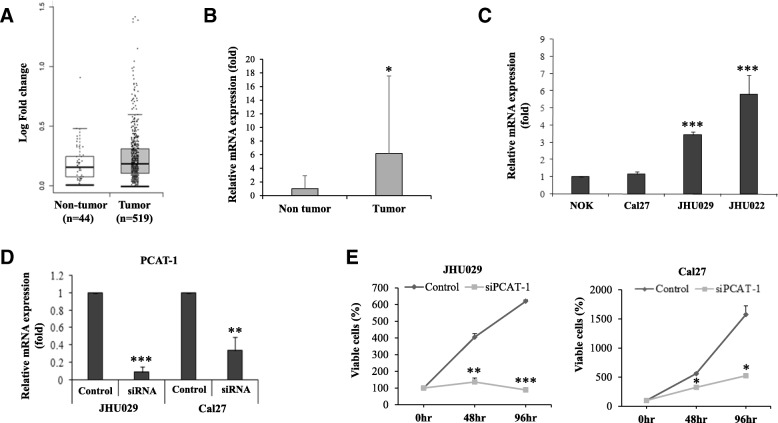
PCAT-1 expression is enhanced in HNSCC and regulates cell proliferation. a: PCAT-1 expression in HNSCC patient samples compared to the non-tumor tissues from the TCGA data. P value < 0.05 was selected as cut off. b: Relative mRNA expression of PCAT-1 gene in HNSCC patient samples (n = 23) compared to adjacent non-tumor tissues. 18 s gene used as internal control. c: Relative mRNA expression of PCAT-1 in HNSCC cell lines compared to NOK. 18 s gene used as internal control. d: JHU029 and Cal27 cells were transfected with PCAT-1 siRNA (50 nM) and after 48 h, PCAT-1 knockdown efficiency was checked by analysing mRNA expression. 18 s gene was used as internal control. e: JHU029 and Cal27 cells were transfected with/ without siRNA. At 0 h, 48 h and 96 h cell were stained with trypan blue and percentage of live cells was counted using a haemocytometer. Small bar indicates standard error (*, p < 0.05; ** p < 0.01; ***p < 0.001)

