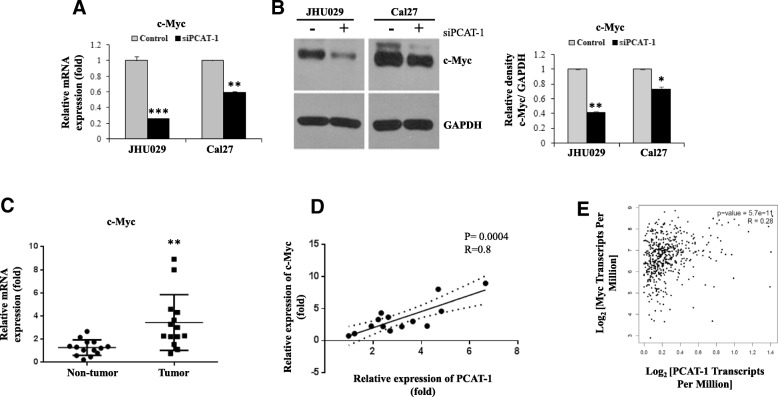
Fig. 2.
Targeting PCAT-1 inhibits c-Myc. a: Relative mRNA expression of c-Myc analysed by qRT-PCR in JHU029 and Cal27 cells with or without transfection of siRNA to PCAT1. Control siRNA was used in parallel. GAPDH gene was used as internal control. b: Cell lysates from JHU029 and Cal27 cells with control or siRNA to PCAT-1 were subjected to Western blot analysis for the c-Myc using specific antibody. The membrane was reprobed with antibody to GAPDH as an internal control. Right panel is quantitative representation of Western blot band intensities using Image-J software. c: Relative mRNA expression of c-Myc in HNSCC tumors (n = 14) compared to the adjacent non-tumor tissues analysed by qRT-PCR. 18 s gene used as internal control. d: Correlation analysis of PCAT-1 and c-Myc expression in HNSCC tumor samples (n = 14). The relationship was evaluated by Pearson’s correlation coefficient (linear regression) with 95% confidence. e: In-silico correlation analysis of expression between PCAT-1 and c-Myc in the HNSCC patient samples of TCGA data analysed by GEPIA (http://gepia.cancer-pku.cn). Small bar indicates standard error (*, p < 0.05; ** p < 0.01; ***p < 0.001)

