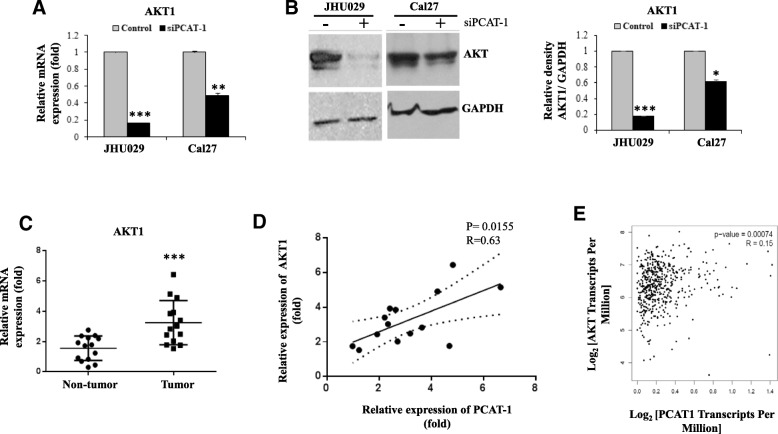
Fig. 3.
Targeting PCAT-1 inhibits AKT1. a: Relative mRNA expression of AKT-1 analysed by qRT-PCR in JHU029 and Cal27 cells with or without transfected with siRNA. Control siRNA was used in parallel. GAPDH gene was used as internal control. b: Cell lysates from JHU029 and Cal27 cells transfected with control or siRNA of PCAT-1 were subjected to Western blot analysis for the AKT1 using specific antibody. The membrane was reprobed with antibody to GAPDH as an internal control. Right panel shows quantitative representation of Western blot band intensities using Image-J software. c: Relative mRNA expression of AKT1 in HNSCC tumors (n = 14) compared to the adjacent non-tumor tissues analysed by qRT-PCR. 18 s gene used as internal control. d: Correlation analysis of PCAT-1 and AKT1 expression in HNSCC tumor samples (n = 14). The relationship was evaluated by Pearson’s correlation coefficient (linear regression) with 95% confidence. e: In-silico correlation analysis of expression between PCAT-1 and AKT in the HNSCC patient samples of the TCGA dataset analysed by GEPIA (http://gepia.cancer-pku.cn). Small bar indicates standard error (*, p < 0.05; ** p < 0.01; ***p < 0.001)

