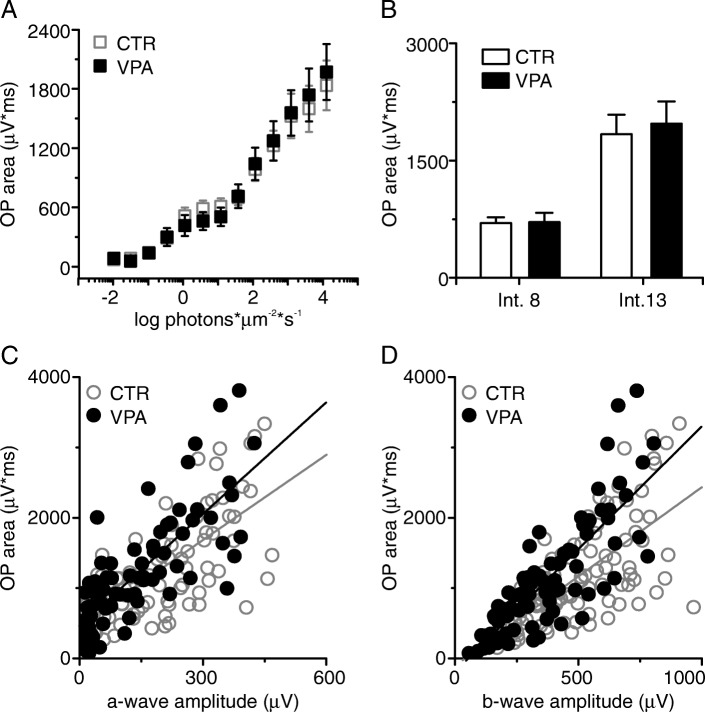
Fig. 4.
OP areas are similar in both groups. a Semi-log plot of mean OP areas (± SEM) obtained at each light intensity for CTR (open symbols, n = 8 animals, 15 eyes) and VPA animals (solid symbols, n = 6 animals, 12 eyes). Areas are similar at all intensities. b Mean OP areas obtained from CTR and VPA animals at light intensity 8 (1.56 log photons*μm−2*s−1) and at light intensity 13 (4.09 log photons*μm−2*s−1). There was no significant difference between groups. Error bars are SEM. c OP area vs. a-wave amplitude for CTR (open symbols) and VPA mice (solid symbols). d OP area vs. b-wave amplitude for CTR (open symbols) and VPA mice (solid symbols). OP areas in VPA mice are significantly larger in relation to the a-wave amplitudes (*p = 0.023) and b-wave amplitudes (***p = 0.0007) in the same trace than those of CTR animals

