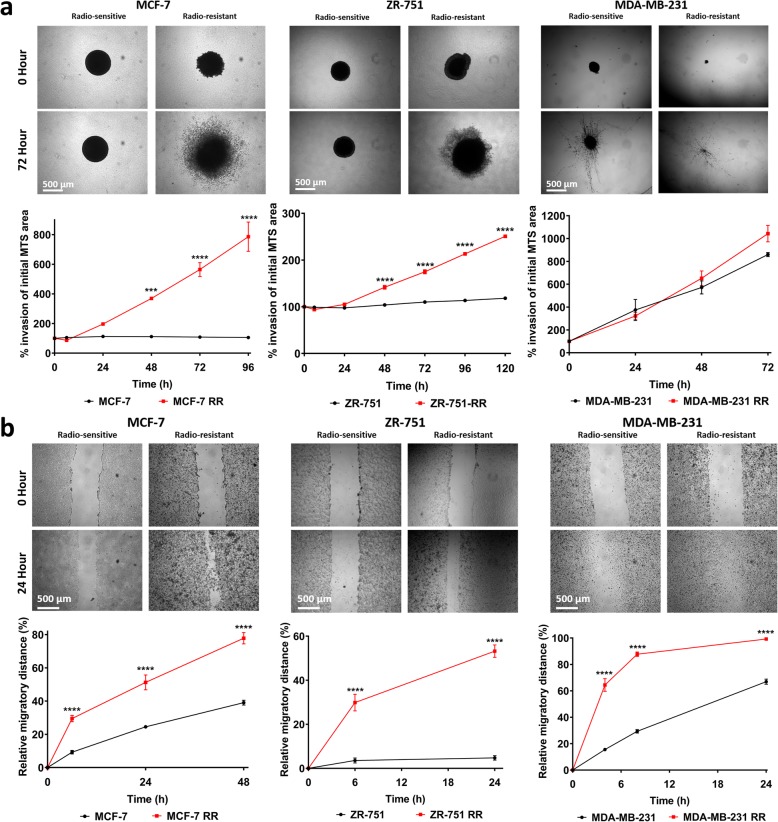
Fig. 3.
Radioresistant cell lines have increased invasion and migration potential. a 3D MTS invasion assays comparing MCF-7 RR, ZR-751 RR and MDA-MB-231 RR MTS with their respective parental MTS. MTS were placed in collagen and invasion was assessed up to 120 h post-seeding. Area of MTS at each time point was calculated and expressed as a % of initial MTS area at day 0. b 2D migration scratch assays comparing MCF-7 RR, ZR-751 RR and MDA-MB-231 RR cell lines with their respective parental cells. Relative migratory distance was calculated at each time point and expressed as a % area devoid of cells based on the initial scratched area at day 0 (2-way ANOVA with Holm-Sidak’s multiple comparisons test; data expressed as mean ± SEM, n = 3, ****p ≤ 0.0001; ***p ≤ 0.001; **p ≤ 0.01)

